3,816
Views
2
CrossRef citations to date
0
Altmetric
Research Article

Rapid and simple colorimetric assay for screening angiotensin I-converting enzyme inhibitors

, , , , , & show all
Pages 1303-1309 | Received 22 Sep 2011, Accepted 07 Mar 2012, Published online: 09 Aug 2012

Figures & data

Table 1.  ACE inhibitory assay procedures.

Figure 1.  Absorption spectra of solutions were prepared according to the procedure described in “Materials and methods”. Line A represents the absorption spectra of the reagent blank. Line B represents the absorption spectra of the mixture of amino acids reacted with DAB-QL solution and acetic anhydride. Line C represents the absorption spectra of the mixture of HA reacted with DAB-QL solution and acetic anhydride.
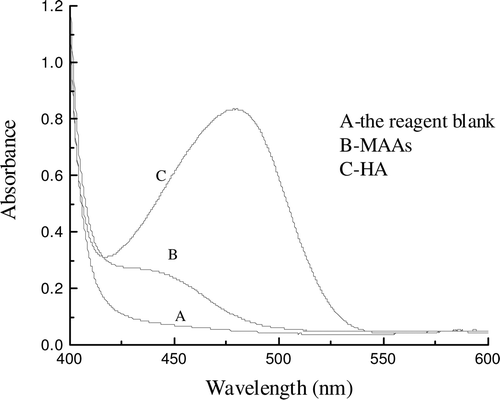
Figure 1.  Absorption spectra of solutions were prepared according to the procedure described in “Materials and methods”. Line A represents the absorption spectra of the reagent blank. Line B represents the absorption spectra of the mixture of amino acids reacted with DAB-QL solution and acetic anhydride. Line C represents the absorption spectra of the mixture of HA reacted with DAB-QL solution and acetic anhydride.

Figure 2.  Effect of incubation time of DAB-QL solution on color development. 100 μL of HA standard solution was allowed to react with 2.0 mL of 2.5% DAB-QL and 0.2 mL of acetic anhydride and at room temperature for 30 min.
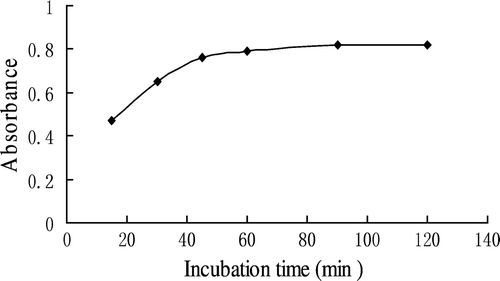
Figure 2.  Effect of incubation time of DAB-QL solution on color development. 100 μL of HA standard solution was allowed to react with 2.0 mL of 2.5% DAB-QL and 0.2 mL of acetic anhydride and at room temperature for 30 min.

Figure 3.  Effect of TEAA amount on color development. HA standard solution (100 µL) was allowed to react with 2.0 mL of 2.5% DAB-QL and 0.2 mL of acetic anhydride at room temperature for 30 min, in the presence of different amounts of TEAA.
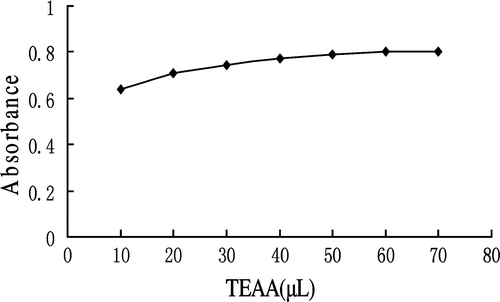
Figure 3.  Effect of TEAA amount on color development. HA standard solution (100 µL) was allowed to react with 2.0 mL of 2.5% DAB-QL and 0.2 mL of acetic anhydride at room temperature for 30 min, in the presence of different amounts of TEAA.

Figure 4.  Effect of ratio of DAB-QL solution to acetic anhydride. Each ratio of DAB-QL solution to acetic anhydride was added to the incubation mixture containing 100 µL of HA per cuvette.
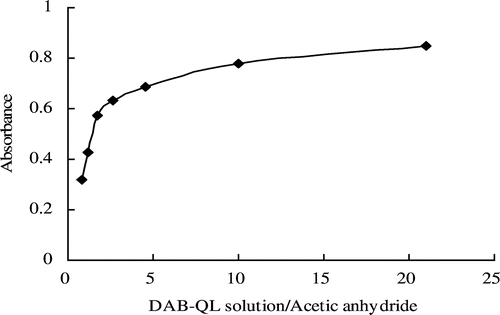
Figure 4.  Effect of ratio of DAB-QL solution to acetic anhydride. Each ratio of DAB-QL solution to acetic anhydride was added to the incubation mixture containing 100 µL of HA per cuvette.

Figure 5.  Effect of the concentration of DAB on color development. HA standard solution (100 µL) was allowed to react with different concentrations of 2.0 mL of DAB-QL solution and 0.2 mL of acetic anhydride at room temperature for 30 min.
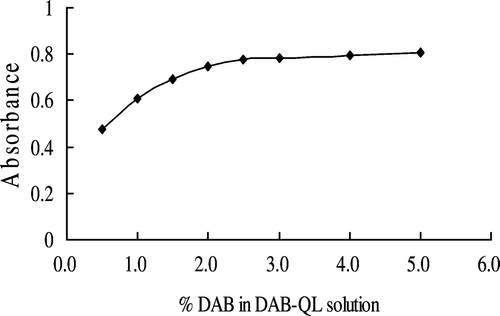
Figure 5.  Effect of the concentration of DAB on color development. HA standard solution (100 µL) was allowed to react with different concentrations of 2.0 mL of DAB-QL solution and 0.2 mL of acetic anhydride at room temperature for 30 min.

Figure 6.  Effect of incubation time on color development at room temperature. HA standard solution (100 µL) was allowed to react with 2.0 mL of 2.5% DAB-QL and 0.2 mL of acetic anhydride for different time periods at room temperature.
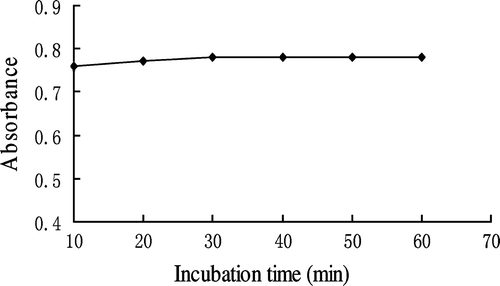
Figure 6.  Effect of incubation time on color development at room temperature. HA standard solution (100 µL) was allowed to react with 2.0 mL of 2.5% DAB-QL and 0.2 mL of acetic anhydride for different time periods at room temperature.

Figure 7.  Effect of water on color development. HA (25 µg) was allowed to react with 2.0 mL of 2.5% DAB-QL solution and 0.2 mL of acetic anhydride at room temperature, in the presence of different amounts of water.
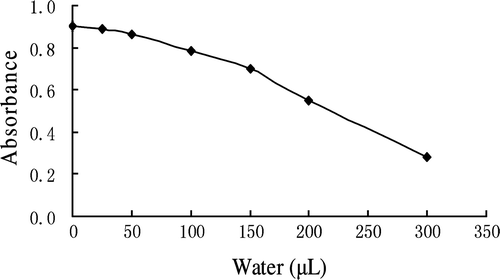
Figure 7.  Effect of water on color development. HA (25 µg) was allowed to react with 2.0 mL of 2.5% DAB-QL solution and 0.2 mL of acetic anhydride at room temperature, in the presence of different amounts of water.

Figure 8.  Absorption spectra of chromogenic reaction solutions in ACE inhibitory activity assay. A control solution and a blank solution in ACE inhibitory activity assay were allowed to react with 2.0 mL of 2.5% DAB-QL solution and 0.2 mL of acetic anhydride at room temperature.
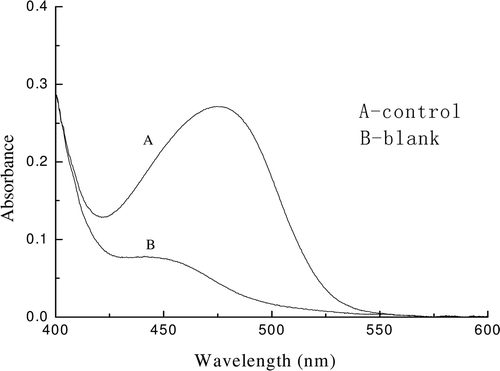
Figure 8.  Absorption spectra of chromogenic reaction solutions in ACE inhibitory activity assay. A control solution and a blank solution in ACE inhibitory activity assay were allowed to react with 2.0 mL of 2.5% DAB-QL solution and 0.2 mL of acetic anhydride at room temperature.

Table 2.  Comparison of the results obtained by the current and HPLC methods.

Reprints and Corporate Permissions

Please note: Selecting permissions does not provide access to the full text of the article, please see our help page How do I view content?

To request a reprint or corporate permissions for this article, please click on the relevant link below:

Academic Permissions

Please note: Selecting permissions does not provide access to the full text of the article, please see our help page How do I view content?

Obtain permissions instantly via Rightslink by clicking on the button below:

If you are unable to obtain permissions via Rightslink, please complete and submit this Permissions form. For more information, please visit our Permissions help page.