630
Views
0
CrossRef citations to date
0
Altmetric
Research Article

Effects of the antimycobacterial compound 2-phenoxy-1-phenylethanone on rat hepatocytes and formation of metabolites

, , &
Pages 1317-1325 | Received 09 Sep 2011, Accepted 08 Mar 2012, Published online: 03 Aug 2012

Figures & data

Figure 1.  Reduced glutathione (GSH) concentrations (µmol/mg of protein) on rat hepatocytes after treatment with 2-phenoxy-1-phenylethanone (LS-2) from 0 to 1 mM for 24 and 48 h. Zero concentration refers to untreated hepatocytes that received only DMEM culture medium containing 1% DMSO. Mean ± SEM for six and two independent experiments for 24 and 48 h, respectively.
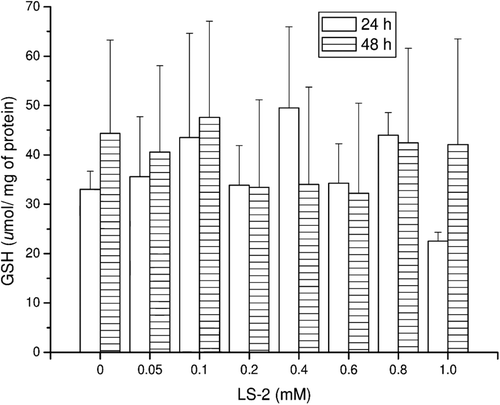
Figure 1.  Reduced glutathione (GSH) concentrations (µmol/mg of protein) on rat hepatocytes after treatment with 2-phenoxy-1-phenylethanone (LS-2) from 0 to 1 mM for 24 and 48 h. Zero concentration refers to untreated hepatocytes that received only DMEM culture medium containing 1% DMSO. Mean ± SEM for six and two independent experiments for 24 and 48 h, respectively.

Figure 2.  TBARS concentrations (nmol/mg of protein) in rat hepatocytes after treatment with 2-phenoxy-1-phenylethanone (LS-2) from 0 to 1 mM for 24 and 48 h. Zero refers to cells incubated with DMEM containing 1% DMSO as control. Mean ± SEM for six and two independent experiments for 24 and 48 h, respectively.
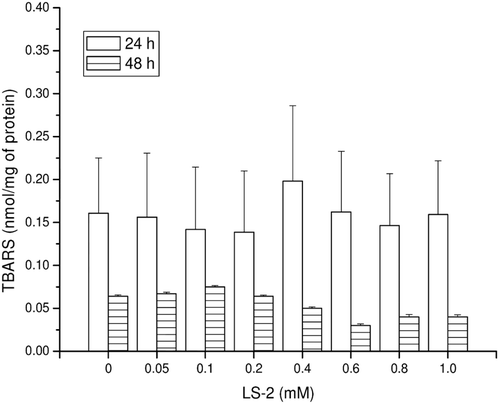
Figure 2.  TBARS concentrations (nmol/mg of protein) in rat hepatocytes after treatment with 2-phenoxy-1-phenylethanone (LS-2) from 0 to 1 mM for 24 and 48 h. Zero refers to cells incubated with DMEM containing 1% DMSO as control. Mean ± SEM for six and two independent experiments for 24 and 48 h, respectively.

Figure 3.  7-methoxyresorufin dealkylase (CYP4501A2) activity in rat hepatocytes after treatment with 2-phenoxy-1-phenylethanone (LS-2) from 0 to 1 mM for 24 h. Results are expressed as amount of 7-resorufin formed per milligram of cell lysate protein (µmol/mg of protein). Mean ± SEM for six independent experiments.
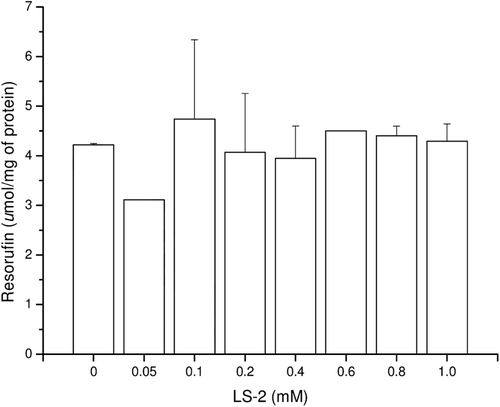
Figure 3.  7-methoxyresorufin dealkylase (CYP4501A2) activity in rat hepatocytes after treatment with 2-phenoxy-1-phenylethanone (LS-2) from 0 to 1 mM for 24 h. Results are expressed as amount of 7-resorufin formed per milligram of cell lysate protein (µmol/mg of protein). Mean ± SEM for six independent experiments.

Figure 4.  Coumarin 7-hydroxylase activity (CYP2A1 and CYP2A2) in rat hepatocytes after treatment with 2-phenoxy-1-phenylethanone (LS-2) from 0 to 1 mM for 48 h. Results expressed as 7-hydroxycoumarin formed per milligram of cell lysate protein (µmol/mg of protein). Mean ± SEM for two independent experiments.
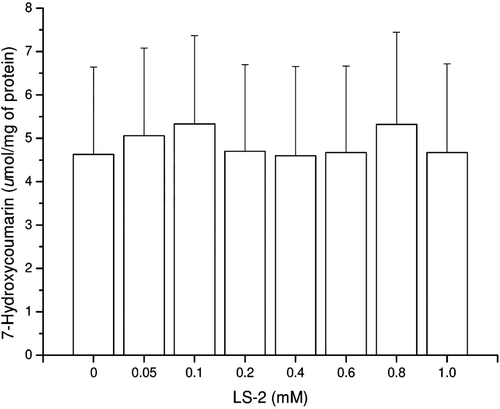
Figure 4.  Coumarin 7-hydroxylase activity (CYP2A1 and CYP2A2) in rat hepatocytes after treatment with 2-phenoxy-1-phenylethanone (LS-2) from 0 to 1 mM for 48 h. Results expressed as 7-hydroxycoumarin formed per milligram of cell lysate protein (µmol/mg of protein). Mean ± SEM for two independent experiments.

Figure 5.  GC-MS profile for 2-phenoxy-1-phenylethanone (LS-2) and metabolites from the hepatocytes treated with LS-2 for 24 h. Peaks one, two, and four represent the LS-2 molecule and metabolites 1 and 2, respectively. Peaks three and five are phthalates; Peak * is an unidentified compound.
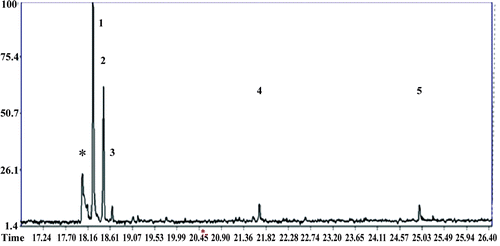
Figure 5.  GC-MS profile for 2-phenoxy-1-phenylethanone (LS-2) and metabolites from the hepatocytes treated with LS-2 for 24 h. Peaks one, two, and four represent the LS-2 molecule and metabolites 1 and 2, respectively. Peaks three and five are phthalates; Peak * is an unidentified compound.

Figure 6.  Mass spectrum (EI): peak with retention time (Rt) = 18.25 min attributed to 2-phenoxy-1-phenylethanone (LS-2).
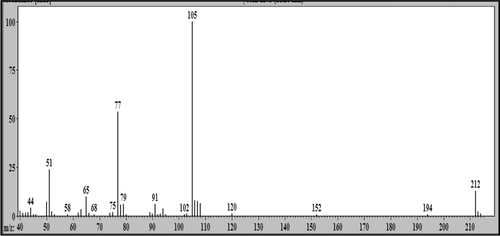
Figure 6.  Mass spectrum (EI): peak with retention time (Rt) = 18.25 min attributed to 2-phenoxy-1-phenylethanone (LS-2).

Figure 7.  Schematic proposal of 2-phenoxy-1-phenylethanone (LS-2) fragmentation.

Figure 7.  Schematic proposal of 2-phenoxy-1-phenylethanone (LS-2) fragmentation.

Figure 8.  Mass spectrum (EI) of the peak with retention time (Rt) = 18.47 min attributed to 2-phenoxy-1-phenylethanol - metabolite 1.

Figure 8.  Mass spectrum (EI) of the peak with retention time (Rt) = 18.47 min attributed to 2-phenoxy-1-phenylethanol - metabolite 1.
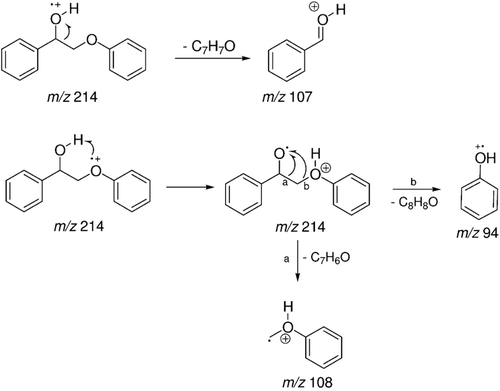
Figure 9.  Schematic proposal for fragmentation of 2-phenoxy-1-phenylethanol - metabolite 1.

Figure 9.  Schematic proposal for fragmentation of 2-phenoxy-1-phenylethanol - metabolite 1.
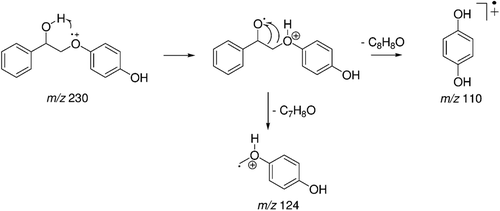
Figure 10.  Mass spectrum (EI) profile of the peak with retention time (Rt) = 21.67 min attributed to 2,4-(2-hydroxy-2-phenylethoxy)phenol - metabolite 2.

Figure 10.  Mass spectrum (EI) profile of the peak with retention time (Rt) = 21.67 min attributed to 2,4-(2-hydroxy-2-phenylethoxy)phenol - metabolite 2.

Figure 11.  Proposal for fragmentation of 2,4-(2-hydroxy-2-phenylethoxy)phenol - metabolite 2.

Figure 11.  Proposal for fragmentation of 2,4-(2-hydroxy-2-phenylethoxy)phenol - metabolite 2.

Reprints and Corporate Permissions

Please note: Selecting permissions does not provide access to the full text of the article, please see our help page How do I view content?

To request a reprint or corporate permissions for this article, please click on the relevant link below:

Academic Permissions

Please note: Selecting permissions does not provide access to the full text of the article, please see our help page How do I view content?

Obtain permissions instantly via Rightslink by clicking on the button below:

If you are unable to obtain permissions via Rightslink, please complete and submit this Permissions form. For more information, please visit our Permissions help page.