Figures & data
Figure 1. Inhibition of tubulin polymerization by compound 14. (A) Kinetics of the inhibition of microtubule assembly by increasing concentrations of compound 14. (B) The IC50 value was obtained from a plot of percent tubulin polymerization against log concentration (M) of compound 14 at 37°C. Inset: column scatter graph of absorbance against the concentration of compound 14 in the reaction mixture. IC50 = 30.14 ± 0.1 µM. (C) TEM micrographs of microtubule polymers in the absence (control) and presence of 30 µM (treated) of compound 14. Scale bars, 2 µm.
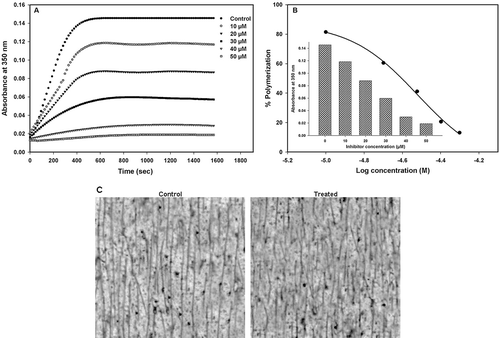
Figure 2. Characterization of the binding of compound 14 with tubulin. (A) Effects of compound 14 on the intrinsic tryptophan fluorescence of tubulin. Tubulin (2 µM) was incubated without or with compound 14 for 30 min at 25°C. The excitation wavelength was 295 nm. (B) Measurement of compound 14 binding to tubulin by fluorescence spectroscopy. Tubulin (1 μM) was incubated with different concentrations of compound 14 and the fluorescence intensity was measured as described in “Materials and Methods”. Inset shows the Scatchard plot of compound 14 binding to tubulin. The λex and λem values were taken at 420 and 500 nm, respectively.
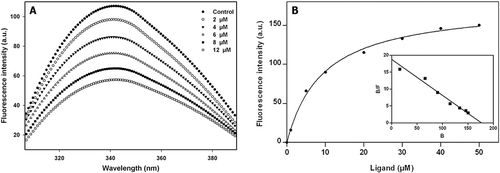
Table 1. Structure, inhibition of tubulin polymerization and cytotoxic activity of new chalcones.
Figure 3. Immunofluorescence (1,3) and Hoechst (2,4) images of SK-N-MC (A) and K562 (B) cells treated with compound 14. Cells were cultured as described in ‘‘Materials and Methods’’ and then incubated without or with 60 µM compound 14. The fixed cells were stained with the antitubulin primary antibody and the secondary antibody. Effects of compound 14 on microtubules and nuclear organization of SK-N-MC (A3,4) and K562 (B3,4) cells are shown (Magnification ×100).
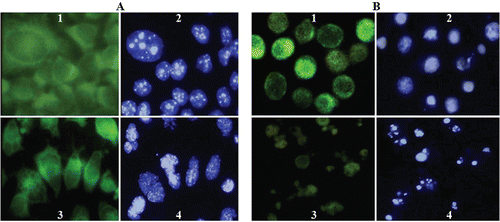
Figure 4. Phase-contrast micrographs and fluorescence of SK-N-MC and K562 cells treated with compound 14. (A) Phase-contrast images of SK-N-MC (1, 2) and K562 (3, 4) cells. Unexposed cells have a polyhedral (1) and round (3) shape indicating live cells. While, exposed cells (60 µM) have a shrunken and condensed form (2, 4). (B) Fluorescence images of AO/EB stained SK-N-MC (1, 2) and K562 (3, 4) cells. Unexposed (1, 3) cells have a normal green nucleus indicating live cells while exposed cells (60 µM) have a bright green nucleus with condensed or fragmented chromatin suggesting apoptosis. (Magnification, ×100).
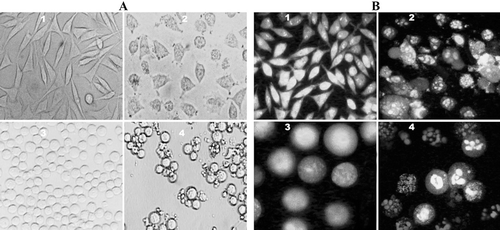
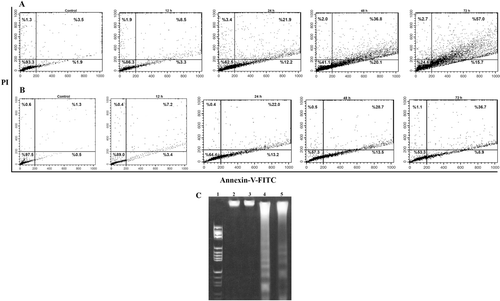
Figure 5. Treatment with compound 14 in a time-dependent manner (12–72 h) induced apoptosis in K562 and SK-N-MC cells. The cells were cultured for 24 h and incubated with 60 µM of compound 14. The cells were harvested after 12, 24, 48, and 72 h, stained with annexin V–FITC and propidium iodide, and analyzed by flow cytometry. Time-dependent treatment of compound 14 increased the percentage of apoptotic cells in K562 (A) and SK-N-MC (B) cells. LR quadrant indicates the percentage of early apoptotic cells, and UR quadrant indicates the percentage of late apoptotic cells. Representative of two independent experiments (C). DNA fragmentation after 72 h of treatment of cells with 60 μmol compound 14. Lane 1: Marker, (HaeIII); Lane 2 (K562) and 3 (SK-N-MC), Control cells; Lane 4 (K562) and 5 (SK-N-MC) treated with compound 14.