Figures & data
Figure 1. The trends of the US per capita daily consumption of B vitamins. (a–d) Average US per capita daily consumption of B vitamins during 1909–2004. (Data were derived from the Economic Research Service of the US Department of Agriculture, http://www.ers.usda.gov/Data/FoodConsumption/NutrientAvailIndex.htm, accessed March 29, 2012). RDA, Recommended Dietary Allowances; EAR, Estimated Average Requirements.
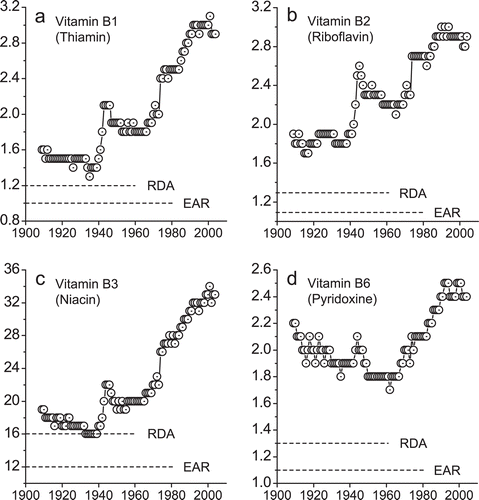
Figure 2. Plasma N1-methylnicotinamide levels after nicotinic acid and nicotinamide load. *P < 0.01 and **P < 0.001 vs. control. NA, nicotinic acid; NM, nicotinamide.
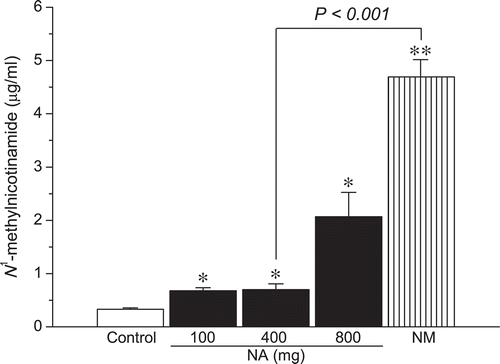
Figure 3. Effect of nicotinic acid and nicotinamide load on H2O2 generation. *P < 0.01 vs. control. NA, nicotinic acid; NM, nicotinamide.
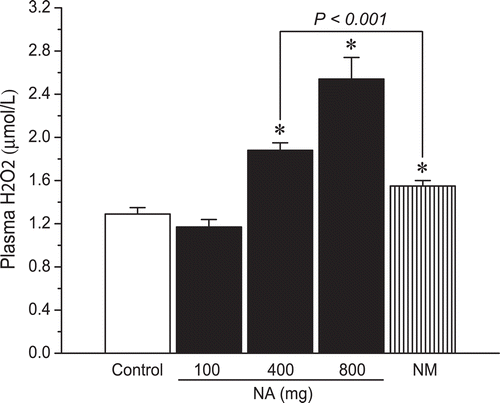
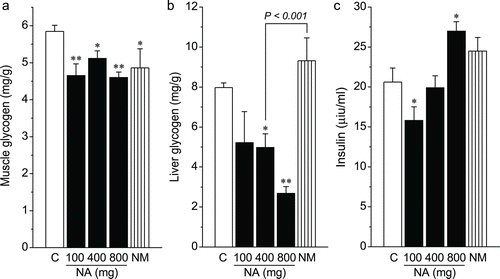
Figure 4. Effects of nicotinic acid and nicotinamide load on glucose metabolism. (a) skeletal muscle glycogen contents, (b) liver glycogen contents, and (c) plasma insulin levels. *P < 0.05 and **P < 0.01 vs. control. NA, nicotinic acid; NM, nicotinamide.