3,055
Views
19
CrossRef citations to date
0
Altmetric
Research Article

Pearl extract enhances the migratory ability of fibroblasts in a wound healing model

, &
Pages 289-297 | Received 10 Feb 2012, Accepted 08 Aug 2012, Published online: 09 Oct 2012

Figures & data

Figure 1.  Optical photomicrographs of Hs68 cells cultured on TCPS in medium in the absence or presence of PL after 7 days of incubation. Scale bar = 100 µm.
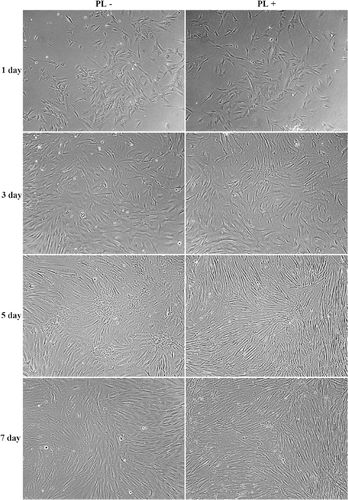
Figure 1.  Optical photomicrographs of Hs68 cells cultured on TCPS in medium in the absence or presence of PL after 7 days of incubation. Scale bar = 100 µm.

Figure 2.  Metabolic activity of Hs68 cells cultured in the absence or presence of PL on TCPS after 7 days of incubation was assayed by MTT. Data were determined from three independent cultures and expressed as mean ± standard deviation.
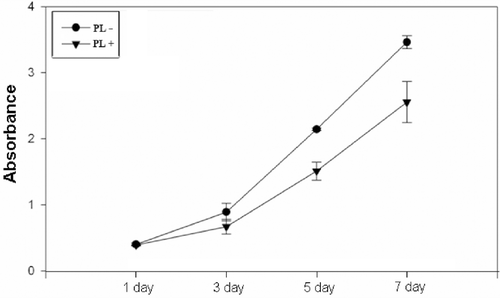
Figure 2.  Metabolic activity of Hs68 cells cultured in the absence or presence of PL on TCPS after 7 days of incubation was assayed by MTT. Data were determined from three independent cultures and expressed as mean ± standard deviation.

Table 1.  Average numbers of migratory Hs68 cells were counted in the scratch site at 0 and 16 h of incubation.

Figure 3.  Dynamical process of in vitro scratch assay with Hs68 cells in medium in the (a) absence or (b) presence of PL on the scratched well at 16 h of incubation. Scale bar = 100 µm.
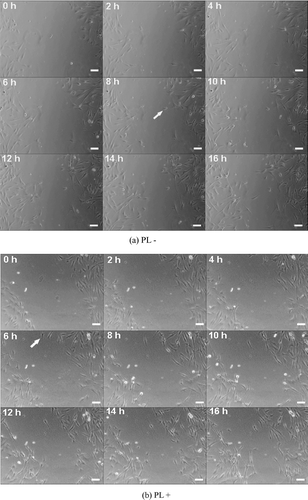
Figure 3.  Dynamical process of in vitro scratch assay with Hs68 cells in medium in the (a) absence or (b) presence of PL on the scratched well at 16 h of incubation. Scale bar = 100 µm.

Figure 4.  The mRNA expression of Collagen Type I and Collagen Type III in Hs68 cells cultured in the absence or presence of PL on TCPS after 1 day of incubation. The results were presented as the ratio of gene expression of Collagen Type III relative to Collagen Type I. *Significant difference as determined by one-way ANOVA followed by the Duncan’s test (p < 0.05).
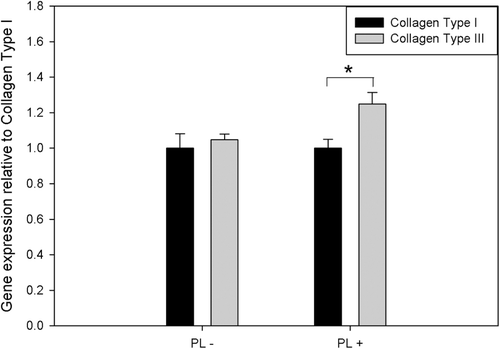
Figure 4.  The mRNA expression of Collagen Type I and Collagen Type III in Hs68 cells cultured in the absence or presence of PL on TCPS after 1 day of incubation. The results were presented as the ratio of gene expression of Collagen Type III relative to Collagen Type I. *Significant difference as determined by one-way ANOVA followed by the Duncan’s test (p < 0.05).

Table 2.  Average numbers of migratory HFFs were counted in the scratch site at 0 and 16 h of incubation.
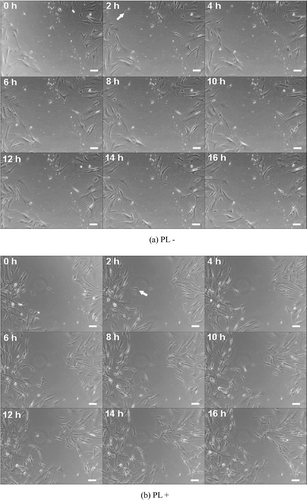
Figure 5.  Dynamic process of the in vitro scratch assay with HFFs in medium in the (a) absence or (b) presence of PL in scratched wells after 16 h of incubation. Scale bar = 100 µm.

Figure 5.  Dynamic process of the in vitro scratch assay with HFFs in medium in the (a) absence or (b) presence of PL in scratched wells after 16 h of incubation. Scale bar = 100 µm.

Reprints and Corporate Permissions

Please note: Selecting permissions does not provide access to the full text of the article, please see our help page How do I view content?

To request a reprint or corporate permissions for this article, please click on the relevant link below:

Academic Permissions

Please note: Selecting permissions does not provide access to the full text of the article, please see our help page How do I view content?

Obtain permissions instantly via Rightslink by clicking on the button below:

If you are unable to obtain permissions via Rightslink, please complete and submit this Permissions form. For more information, please visit our Permissions help page.