Figures & data
Figure 1. Chromatogram of one indo alkaloid-enriched bioactive extract. Peaks identified with commercial patterns were: peak 2 (catharanthine) and peak 3 (ajmalicine). Identification based on both absorbance spectrum and retention time gave peak 1 (putative lochnericine) and peak 4 (putative tabersonine).
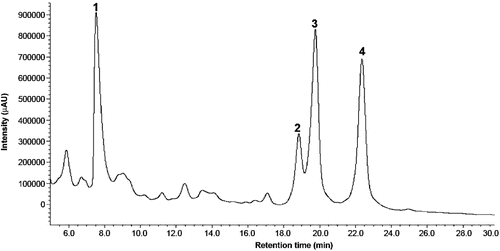
Figure 2. MS spectra of the identified indole alkaloids by HPLC-DAD-ESI-TOF/MS.
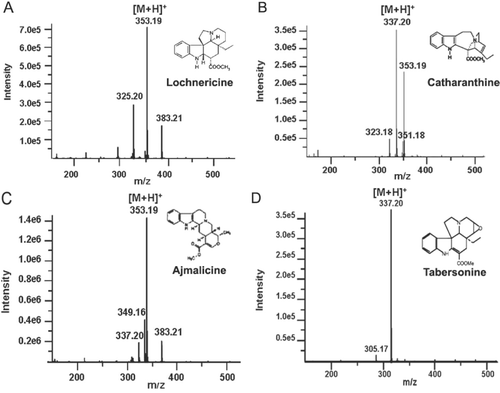
Figure 3. Cytotoxic effect of different concentrations of indole alkaloid-enriched bioactive extract on the cell lines, JURKAT E.6 (diamond), THP-1 (triangle) and BL 1395 (circle). Mean values ± SD based on six replicate samples obtained in a single experiment.
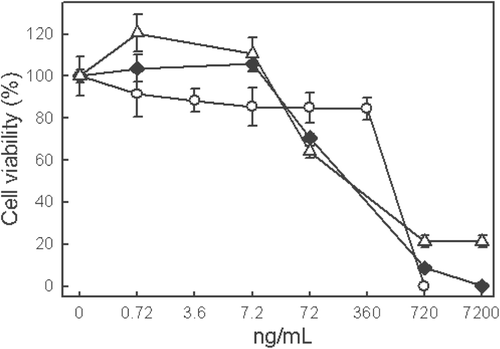
Figure 4. Time course of cytotoxic effect of different concentrations of indole alkaloid-enriched bioactive extract on THP-1 cell line. Mean values ± SD based on six replicate samples obtained in a single experiment. *p < 0.05 in relation to the control.
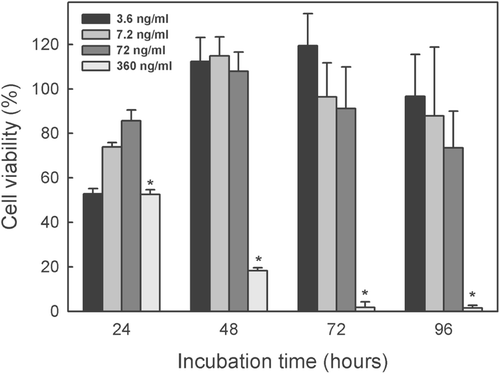
Figure 5. Time course of cytotoxic effect of different concentrations of indole alkaloid-enriched bioactive extract on JURKAT E.6 cell line. Mean values ± SD based on six replicate samples obtained in a single experiment. *p < 0.05 in relation to the control.
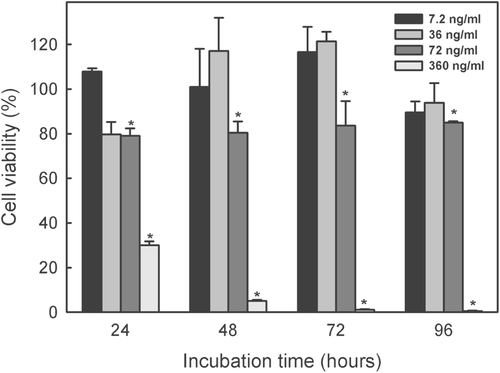
Figure 6. Cytotoxic activity of commercial ajmalicine (square) and catharanthine (circle) at different concentrations on JURKAT E.6 (A) and THP-1 (B) cell lines. Cytotoxic effect of the joint action of commercial ajmalicine and catharanthine (C) at different concentrations on cell lines, JURKAT E.6 (white circle) and THP-1 (black circle). Mean values ± SD based on six replicate samples obtained in a single experiment.
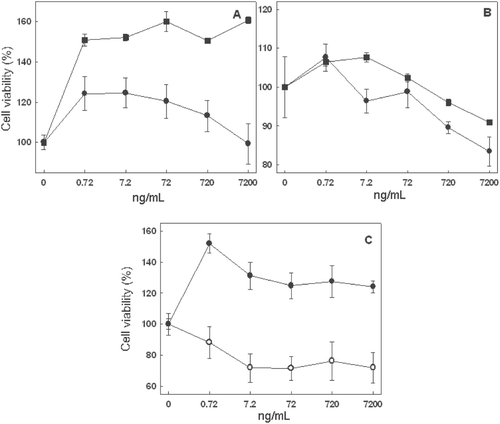
Table 1. IC50 values obtained from vegetable extract enriched in different types of alkaloid.