685
Views
7
CrossRef citations to date
0
Altmetric
Research Article

Neuroprotective effect of a caffeic acid derivative from Abacopteris penangiana

, , &
Pages 376-382 | Received 27 Apr 2012, Accepted 18 Sep 2012, Published online: 14 Feb 2013

Figures & data

Figure 1  . Structure of the caffeic acid derivative (7′Z)-3-O-(3, 4-dihydroxyphenylethenyl)-caffeic acid (CADP).
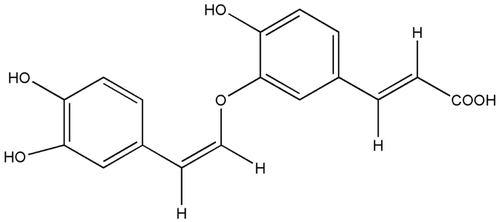
Figure 1  . Structure of the caffeic acid derivative (7′Z)-3-O-(3, 4-dihydroxyphenylethenyl)-caffeic acid (CADP).

Figure 2  . Protective effect of (7′Z)-3-O-(3, 4-dihydroxyphenyl-ethenyl)-caffeic acid (CADP) against H2O2-induced PC12 cell injury. Cells were incubated with 200 μM H2O2 for 4 h for MTT assay. CADP was added to the culture 24 h before H2O2 addition. The data are presented as means ± SEM (n = 6). #p < 0.05 and ##p < 0.01 compared with H2O2 group.
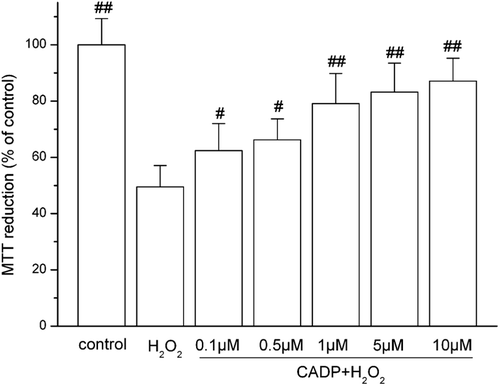
Figure 2  . Protective effect of (7′Z)-3-O-(3, 4-dihydroxyphenyl-ethenyl)-caffeic acid (CADP) against H2O2-induced PC12 cell injury. Cells were incubated with 200 μM H2O2 for 4 h for MTT assay. CADP was added to the culture 24 h before H2O2 addition. The data are presented as means ± SEM (n = 6). #p < 0.05 and ##p < 0.01 compared with H2O2 group.

Figure 3  . Effects of (7′Z)-3-O-(3, 4-dihydroxyphenylethenyl)-caffeic acid (CADP) on the spatial learning and memory of mice in the Morris water maze test. (A) Mean latency in the hidden platform test during five consecutive days training. (B) Swimming distance moved in the hidden platform test during five consecutive days training. (C) The number of crossings over the exact location of the former platform. (D) Time spent in the target quadrant. All values are expressed as means ± SEM (n = 6–7). #p < 0.05 and ##p < 0.01 compared with the d-galactose (d-gal) model group.
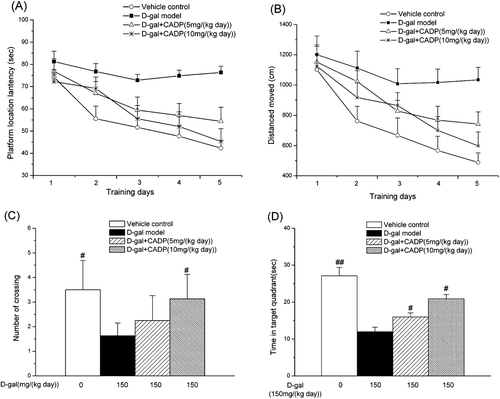
Figure 3  . Effects of (7′Z)-3-O-(3, 4-dihydroxyphenylethenyl)-caffeic acid (CADP) on the spatial learning and memory of mice in the Morris water maze test. (A) Mean latency in the hidden platform test during five consecutive days training. (B) Swimming distance moved in the hidden platform test during five consecutive days training. (C) The number of crossings over the exact location of the former platform. (D) Time spent in the target quadrant. All values are expressed as means ± SEM (n = 6–7). #p < 0.05 and ##p < 0.01 compared with the d-galactose (d-gal) model group.
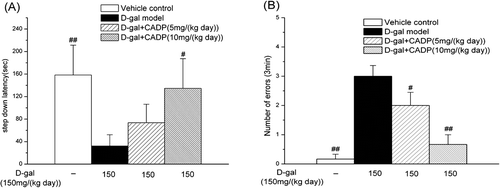
Figure 4  . The step-down avoidance test of all groups of mice. (A) The average step-down latency; (B) The average number of errors in 3 min. Data are expressed as means ± SEM (n = 6–7). #p < 0.05 and ##p < 0.01 compared with the d-galactose (d-gal) model group.

Figure 4  . The step-down avoidance test of all groups of mice. (A) The average step-down latency; (B) The average number of errors in 3 min. Data are expressed as means ± SEM (n = 6–7). #p < 0.05 and ##p < 0.01 compared with the d-galactose (d-gal) model group.

Table 1.  Effect of CADP on MDA levels and activities of SOD, Gpx, and catalase in mouse brain.

Reprints and Corporate Permissions

Please note: Selecting permissions does not provide access to the full text of the article, please see our help page How do I view content?

To request a reprint or corporate permissions for this article, please click on the relevant link below:

Academic Permissions

Please note: Selecting permissions does not provide access to the full text of the article, please see our help page How do I view content?

Obtain permissions instantly via Rightslink by clicking on the button below:

If you are unable to obtain permissions via Rightslink, please complete and submit this Permissions form. For more information, please visit our Permissions help page.