Figures & data
Figure 1. The structure of catalpol.
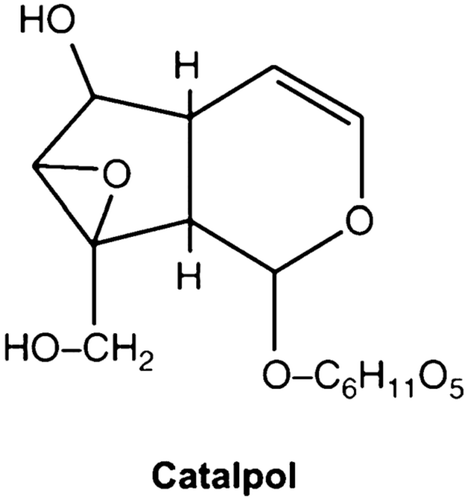
Figure 2. Effects of catalpol treatment on myocardial functions in rats subjected to 30 min of myocardial ischemia and 3 h of reperfusion (n = 8/group). LVSP: left ventricular systolic pressure; ± LVdP/dtmax: the instantaneous first derivation of left ventricle pressure; Sham: sham-operated; MI/R: myocardial ischemia/reperfusion (30 min/3 h); C: catalpol, W: wortmannin. Values presented are means ± SEM. **p < 0.01 vs. Sham, ##p < 0.01 vs. MI/R, αp < 0.05, ααp < 0.01 vs. MI/R+C.
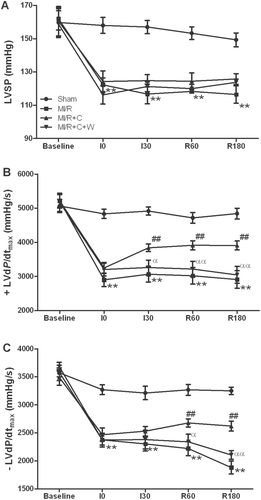
Figure 3. Myocardial injury in rats subjected to MI/R with different treatments (n = 8/group). (A): myocardial infarct size (INF) expressed as percentage of area at risk (AAR). (B): plasma creatine kinase (CK) and lactate dehydrogenase (LDH) activities. (C): apoptotic index (percentage of TUNEL-positive nuclei in heart tissue sections). (D): myocardial caspase-3 activity. Sham: sham-operated; MI/R: myocardial ischemia/reperfusion (30 min/3 h); C: catalpol, W: wortmannin. Values presented are means ± SEM; **p < 0.01 vs. Sham, #p < 0.01, ##p < 0.01 vs. MI/R, αp < 0.05 vs. MI/R+C.
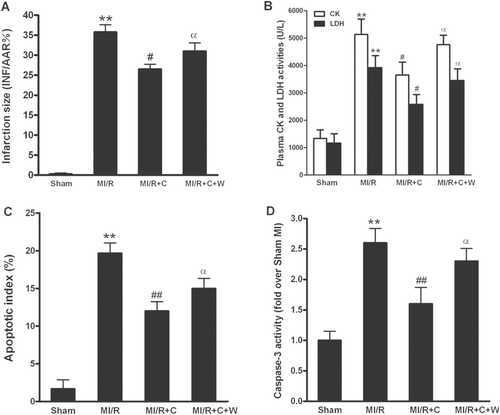
Figure 4. Nitrotyrosine production in rat hearts subjected to MI/R with different treatments (n = 8/group). Sham: sham-operated; MI/R: myocardial ischemia/reperfusion (30 min/3 h); C: catalpol, W: wortmannin. Values presented are means ± SEM. **p < 0.01 vs. Sham, ##p < 0.01 vs. MI/R, αp < 0.05 vs. MI/R+C.
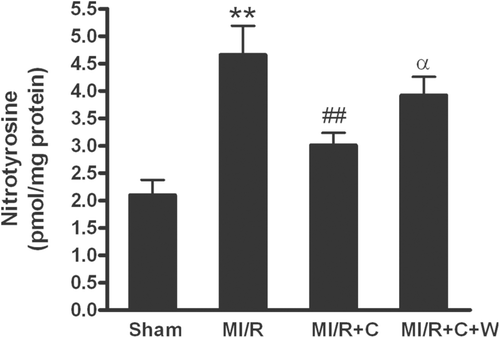
Figure 5. Phosphorylation of eNOS, NO production and iNOS expression by in vivo catalpol treatment and its modification by wortmannin. (A): representative blots of phosphorylated eNOS and total eNOS/iNOS in heart tissue from rats subjected to MI/R with different treatments. (B): statistical data obtained from quantitative densitometry of iNOS blots; (C): statistical data obtained from quantitative densitometry of p-eNOS/eNOS; (D): NO production in cardiac tissue. Sham: sham-operated; MI/R: myocardial ischemia/reperfusion (30 min/3 h); C: catalpol, W: wortmannin. Values presented are means ± SEM. n = 8. *p < 0.05, **p < 0.01 vs. Sham, #p < 0.05, ##p < 0.01 vs. MI/R, αp < 0.05, ααp < 0.01 vs. MI/R+C.
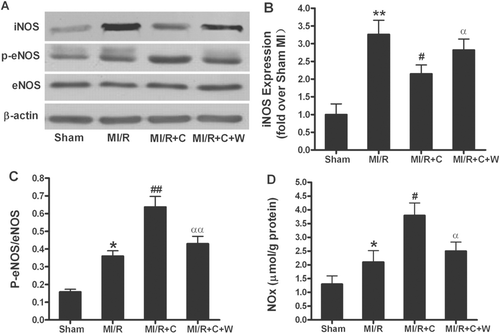
Figure 6. Catalpol exerted anti-oxidative stress effects in rats subjected to MI/R. (A): superoxide production in myocardium; Myocardial superoxide content was quantified with lucigenin-enhanced luminescence; RLU, relative light units. (B): gp91phox protein expression; Inserted gel photographs are representative Western blot results from 4 to 5 animals/group. (C): malonaldialdehyde (MDA) level in myocardium. (D): activity of antioxidant enzyme superoxide dismutase (SOD) in myocardium. Sham: sham-operated; MI/R: myocardial ischemia/reperfusion (30 min/3 h); C: catalpol, W: wortmannin. Values presented are means ± SEM. n = 8. *p < 0.05, **p < 0.01 vs. Sham, #p < 0.05 vs. MI/R, αp < 0.05 vs. MI/R+C.
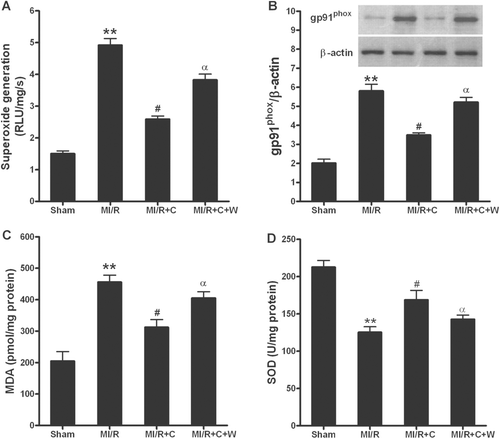
Figure 7. Phosphorylation of Akt by in vivo catalpol treatment and its modification by wortmannin. Sham: sham-operated; MI/R: myocardial ischemia/reperfusion (30 min/3 h); C: catalpol, W: wortmannin. Values presented are means ± SEM. n = 6. *p < 0.05 vs. Sham, ##p < 0.01 vs. MI/R, ααp < 0.01 vs. MI/R+C.
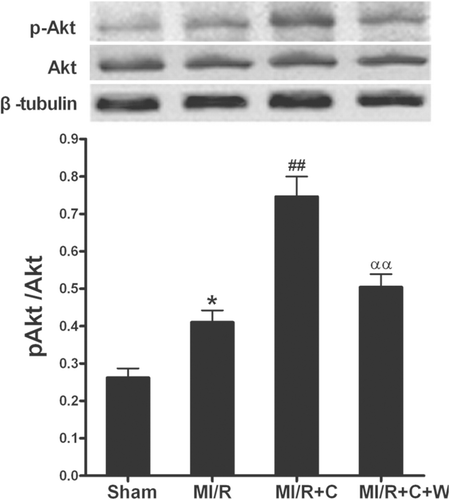
Figure 8. Nitrotyrosine production (A) and infarction size (B) in rats subjected to MI/R with different treatments. MI/R: myocardial ischemia/reperfusion (30 min/3 h); UA: uric acid; C: catalpol. Values presented are means ± SEM. n = 6. **p < 0.01 vs. MI/R.
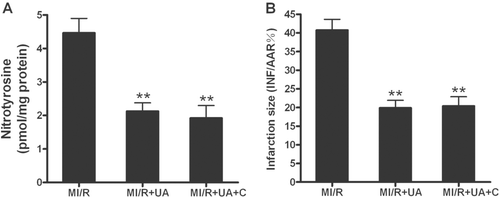
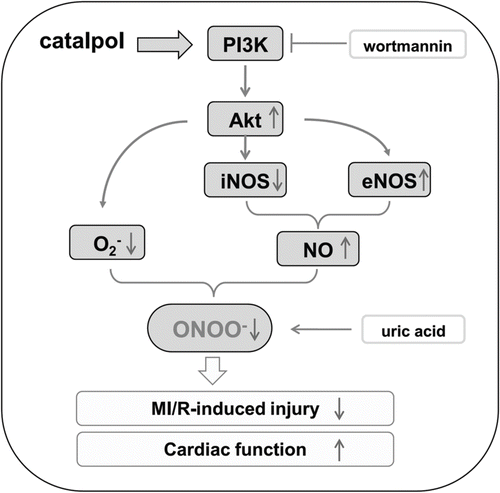
Figure 9. Proposed antioxidative/antinitrative signaling pathway by catalpol. eNOS: endothelial nitric oxide synthase; iNOS: inducible nitric oxide synthase; MI/R: myocardial ischemia/reperfusion; NO: nitric oxide; ·O2−: superoxide anion; ONOO−: peroxynitrite.