Figures & data
Table 1. Hematological indices of the C, LD (LD = 30 mg/kg b.wt.) and HD (HD = 300 mg/kg b.wt.) groups 90 days after the administration of P. niruri aqueous leaf extract on S–D rats.
Table 2. Biochemical parameters of the C, LD (LD = 30 mg/kg b.wt.) and HD (HD = 300 mg/kg b.wt.) groups 90 days after the administration of P. niruri aqueous leaf extract on S–D rats.
Figure 1. The estrogen levels of the various groups. The LD and HD levels of 385 ± 122 pg/ml and 962 ± 357 pg/ml, respectively, were statistically different from the C group level of 192 ± 25 pg/ml. Statistically, a versus b and a versus c were different, p = 0.001 and p = 0.001, respectively. Furthermore, b was significantly different from c (p = 0.001).
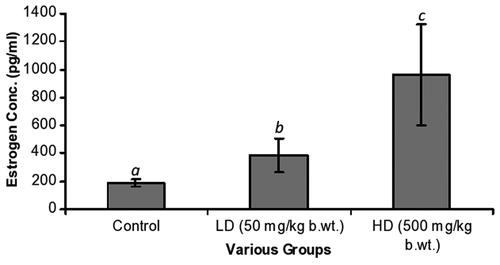
Figure 2. The progesterone levels of the C and experimental groups. The LD and HD groups had progesterone levels of 155 ± 45 pg/ml and 320 ± 80 pg/ml, respectively. Statistical differences between a′ and b′ as well as a′ and c′ were p = 0.001; p = 0.001, respectively.
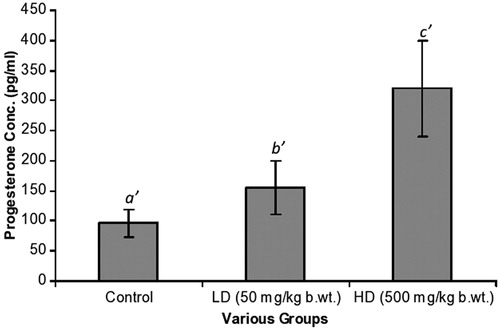
Figure 3. Testosterone levels. Levels declined from 5210 ± 1090 pg/ml (C), 4710 ± 220 pg/ml (LD) to 4500 ± 580 pg/ml (HD). Comparing b″ and c″ to a″, differences were not statistically significant.
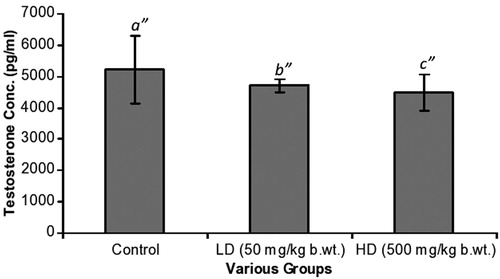
Figure 4. Photomicrographs of the testes (both C and P. niruri treated groups). (a, b and c) are sections of the testes of the C, LD and HD groups, respectively, at a lower magnification of ×100 (H&E), while (d, e and f) are higher magnifications (×400 H&E) in the same order. The extract affected the seminiferous tubules (s), reducing their diameters as the dose increased from 50 (4b) to 500 mg/kg b.wt. (4c) with an apparent shrinkage, suggestive of fluid accumulation in the testes.
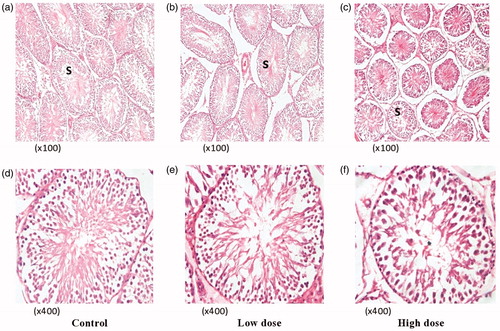
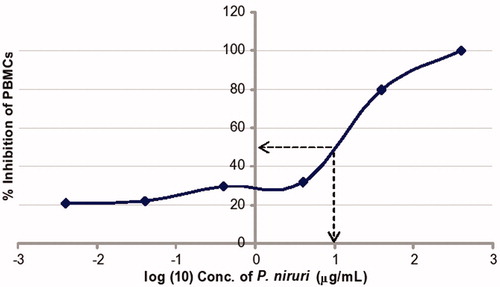
Figure 5. Cytotoxicity test of the aqueous leaf extract of P. niruri on PBMC as measured by the LDH cytotoxicity assay at the end of 24 h of exposure. From the graph, the cytotoxic concentration of P. niruri at 50% (CC50) inhibition of PBMCs gave a log concentration of 1.0 whose antilog is 10.0 µg/ml.