Figures & data
Table 1. 1H- and 13C-NMR data for compound 1a.
Figure 1. Proliferation and apoptotic alterations of MCF-7 breast cancer cells and non-tumorigenic MCF-12A mammary epithelial cells after 48 h incubation with different concentrations (0.01, 0.1, 1, 10 µg/mL) of compound 1 and 0.1% DMSO as negative control substance. Both measurements were determined by flow cytometry. Proliferation phase was the sum of the G2/M and S phase. Apoptotic cells were calculated from the sub-G1 phase. Negative control treatment with DMSO was set to 100%. n = 3, means ± SD, statistical significance was determined by the unpaired t-test (***p < 0.001).
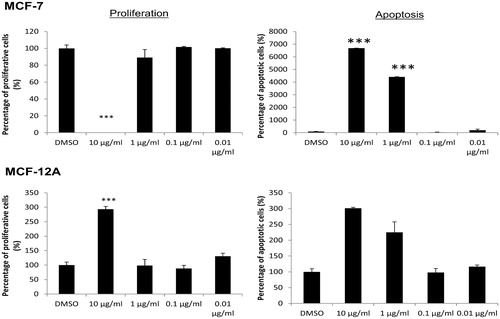
Figure 2. Online monitoring of adhesion and acidification rates of the MCF-7 breast cancer cell line in comparison with the non-tumorigenic epithelial cell line MCF-12 A under treatment with compound 1 (final concentration 0.1 μg/mL) using the Bionas® 2500 analyzing system. Gray shadowed area marks the adaption phase (4 h) of the cells to the new conditions in pure running medium. Treatment with compound 1 was carried out for 20 h at a flow rate of 56 μL/min with 4/4 min pump/stop phases. The percentage of the standardized and normalized rates of cell adhesion and extracellular acidification in a period of 24 h are displayed. The averages of three individual experiments are shown.
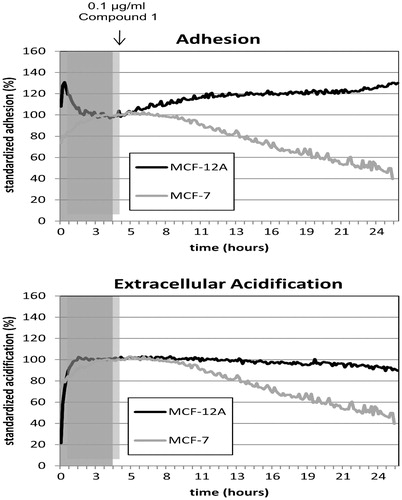
Figure 3. Integrin (β1, β3; α2–α6, αv) and HA receptor expression of MCF-7 and MCF-12A cells after treatment with 0.1 and 1 µg/mL with compound 1 for 48 h measured by flow cytometry. Graphs presenting the relative expression rates normalized to the control measurements with DMSO as negative control. Controls were set to 100% which is represented by 1 in the graph meaning that values below 1 show a reduction of the receptor expression and an increase in the values above 1. The mean values of the measurements refer to the tables below. n = 3, means, statistical significance was determined by the unpaired t-test (*p < 0.05, **p < 0.005, and ***p < 0.001).
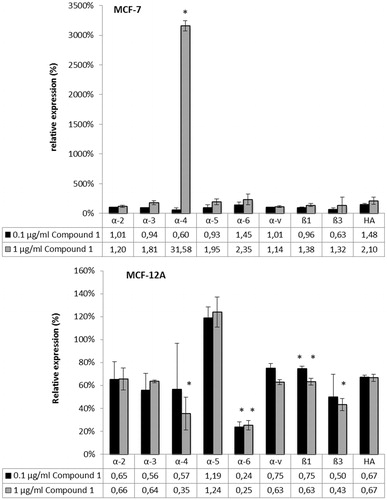
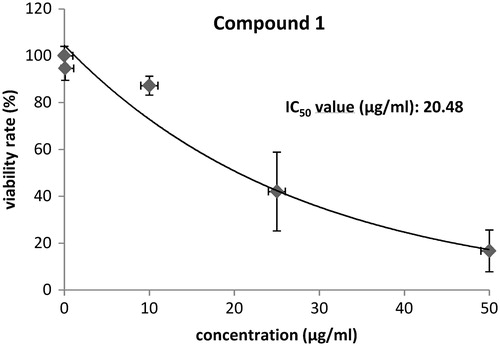
Figure 4. Calculation of the IC50 value of compound 1 on MCF-7 breast cancer cells by MTS tests.