Figures & data
Figure 1. Effect of CLE on a mouse isolated uterine horn. CLE (0.025, 0.05 and 0.1 mg/mL) was added to the bath-fluid at the upward-pointing solid arrow.
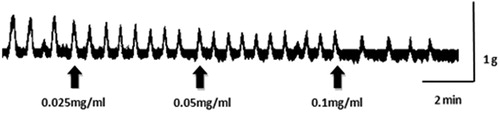
Figure 2. Concentration-effect curve of CLE (0.025, 0.05 and 0.1 mg/mL) on contractions of spontaneously contracting mice isolated uterine horns. Vertical bars represent standard deviation of mean (SD), n = 10. **p < 0.01; versus distilled water-treated controls.
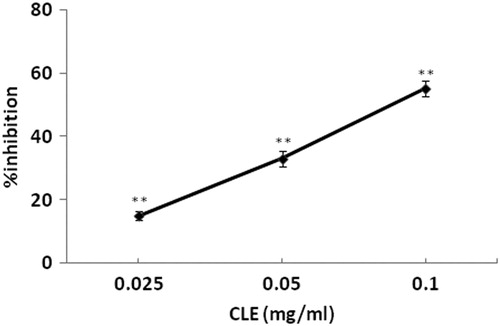
Figure 3. Effect of CLE on a mouse isolated uterine horn, which is pretreated with propranolol (10−6 M). CLE (0.025, 0.05 and 0.1 mg/mL) was added to the bath-fluid at the upward-pointing solid arrow.
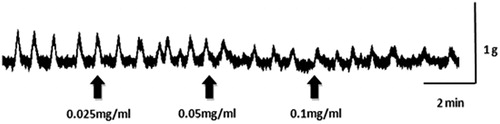
Figure 4. Concentration-effect curve of CLE (0.025, 0.05 and 0.1 mg/mL) on contractions of mice isolated uterine horns pretreated with propranolol (10−6 M). Vertical bars represent the SD of mean, n = 10. **p < 0.01; versus distilled water-treated controls.
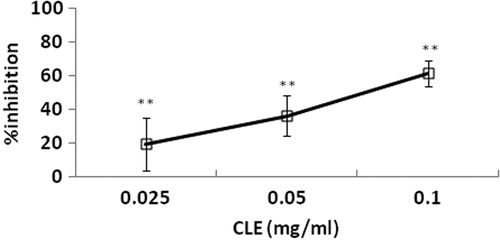
Figure 5. Concentration-effect curves of CLE (0.025, 0.05, 0.1 mg/mL) on contractions of mice isolated uterine horns induced by (A) KCl (40 mM), (B) ACh (5 μg/mL), (C) CCh (5 μg/mL), (D) OT (2U/L) and (E) bradykinin (5 ng/mL)-contractile. Vertical bars represent the SD of mean, n = 10. **p < 0.01; versus distilled water-treated controls.
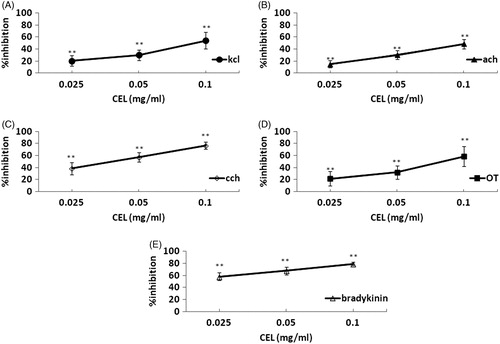
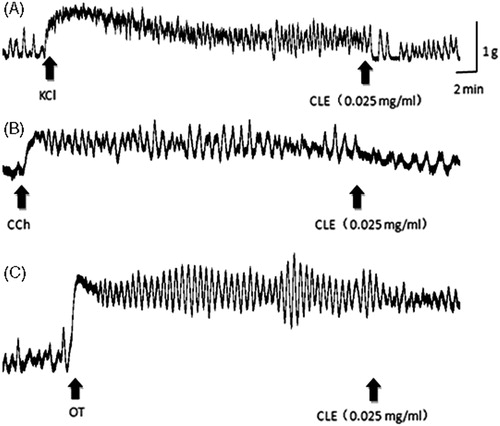
Figure 6. Effects of CLE (0.025 mg/mL) on contractions of mouse isolated uterine horns induced by (A) KCl (40 mM), (B) CCh (5 μg/mL) and (C) OT (2U/L).