Figures & data
Figure 1. Structure of TET.
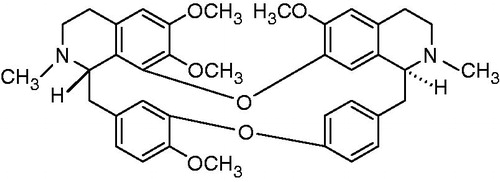
Figure 2. The expression levels of the drug resistance genes CDR1, CDR2, MDR1, FLU1 and ERG11 in fluconazole-sensitive CA-3 cells that were either treated with FLC and/or TET relative to those in untreated cells. The ratios represent the mean ± standard deviations for three independent experiments. *p < 0.05 versus control cells.
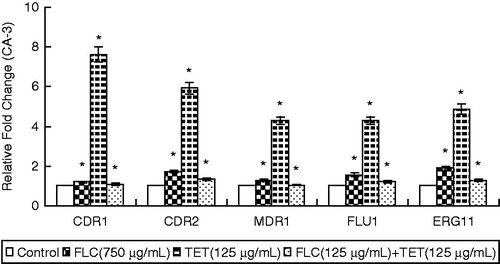
Figure 3. The expression levels of the drug resistance genes CDR1, CDR2, MDR1, FLU1 and ERG11 in fluconazole-resistant CA-16 cells that were either treated with FLC and/or TET relative to those in untreated cells. The ratios represent the mean ± standard deviations for three independent experiments. *p < 0.05 versus control cells.
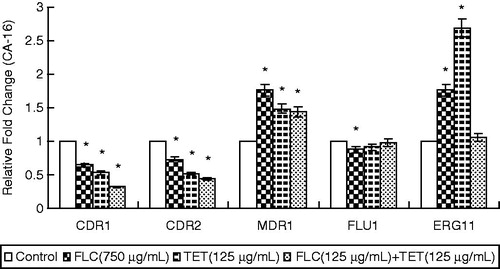
Figure 4. Intracellular ATP content in fluconazole-sensitive CA-3 and resistant CA-16 cells that were either treated with FLC and/or TET or left as untreated controls. ATP levels represent the mean ± standard deviations for three independent experiments. *p < 0.05 versus control cells.
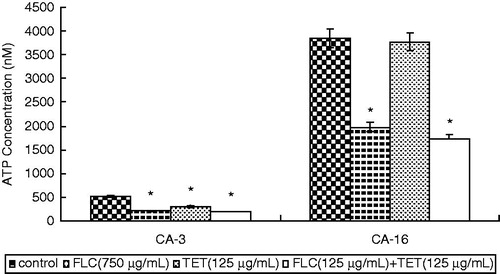
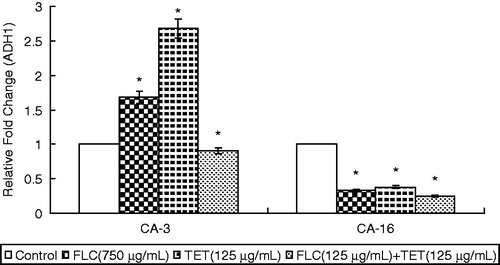
Figure 5. The expression levels of the energy metabolism gene ADH1 in fluconazole-sensitive CA-3 and resistant CA-16 cells that were either treated with FLC and/or TET relative to those in untreated cells. The ratios represent the mean ± standard deviations for three independent experiments. *p < 0.05 versus control cells.