Figures & data
Figure 1. Effects of clarithromycin on Kv1.3 channel currents in murine thymocytes. The effects of 30 µM (A) and 100 µM (B) clarithromycin. (a) Typical whole-cell current traces at different voltage-steps recorded before and after either drug application. The currents were elicited by voltage-steps from the holding potentials of −80 mV to −40, 0, 40 and 80 mV, as shown in the voltage protocol. Each pulse was applied for a 200-ms duration between 10 s intervals. (b) Peak current densities (peak currents normalized by the membrane capacitance) obtained from the records in (a) at the voltage-step of 80 mV. (c) Percentages of the pulse-end currents relative to the peak currents (100 * I/Ipeak) obtained from the records in (a) at the voltage-step of 80 mV. #p < 0.05 versus before the drug application. Values are means ± SEM (n = 5). Differences were analyzed by ANOVA followed by Dunnett’s or Student’s t test.
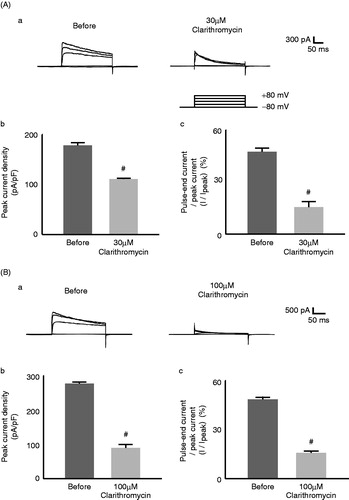
Figure 2. Effects of azithromycin on Kv1.3 channel currents in murine thymocytes. The effects of 30 µM (A) and 100 µM (B) azithromycin. (a) Typical whole-cell current traces at different voltage-steps recorded before and after either drug application. The currents were elicited by voltage-steps from the holding potentials of −80 mV to −40, 0, 40 and 80 mV, as shown in the voltage protocol. Each pulse was applied for a 200-ms duration between 10 s intervals. (b) Peak current densities (peak currents normalized by the membrane capacitance) obtained from the records in (a) at the voltage-step of 80 mV. (c) Percentages of the pulse-end currents relative to the peak currents (100 * I/Ipeak) obtained from the records in (a) at the voltage-step of 80 mV. Values are means ± SEM (n = 5). Differences were analyzed by ANOVA followed by Dunnett’s or Student’s t test.
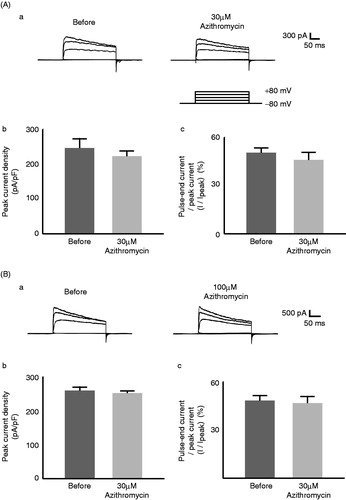
Figure 3. Clarithromycin or azithromycin-induced changes in thymocyte membrane capacitance, series and membrane conductance. After establishing the whole-cell configuration, external solutions containing no drugs (A), 30 µM clarithromycin (B) or azithromycin (C) were delivered for 30 s to single thymocytes. Membrane capacitance, series and membrane conductance were monitored for at least 2 min. n = 5 for each trace.
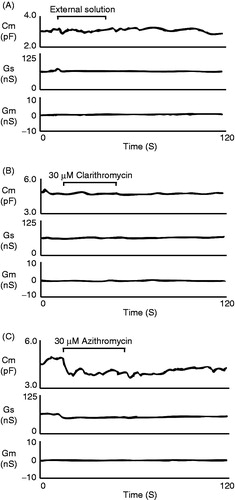
Table 1. Summary of changes in membrane capacitance after application of clarithromycin and azithromycin.