Figures & data
Table 1. Optical density and content of DNA isolated from different accessions of S. rebaudiana.
Figure 1. RAPD amplification pattern using the primers OPA 1. M, molecular size markers. Lane numbers correspond to places from which Stevia rebaudiana is collected: 1, Bangalore; 2, Dehradun (a); 3, Dehradun (b); 4, Delhi; 5, Haridwar; 6, Indore; 7, Jammu (a); 8, Jammu (b); 9, Kangra; 10, Mohali; 11, Surat.
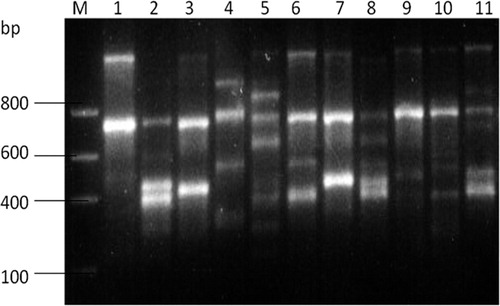
Table 2. Optimization of composition of 15 µL amplification reaction mixture containing PCR ingredients.
Table 3. Optimized conditions for PCR amplifications.
Table 4. Polymorphism exhibited by RAPD primers in S. rebaudiana.
Figure 2. UPGMA dendogram showing the relationships among the eleven accessions of Stevia varieties.
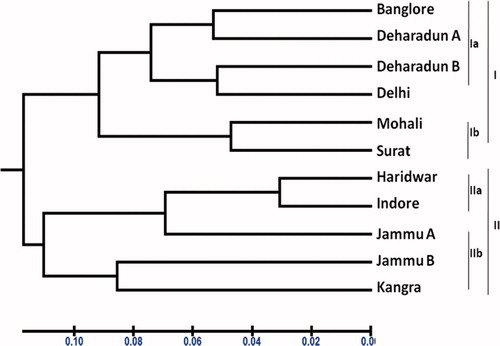
Table 5. Similarity matrix table of 11 samples of S. rebaudiana.
Figure 3. HPTLC chromatogram of samples of Stevia extract in daylight after spraying with anisaldehyde-sulphuric acid solution.
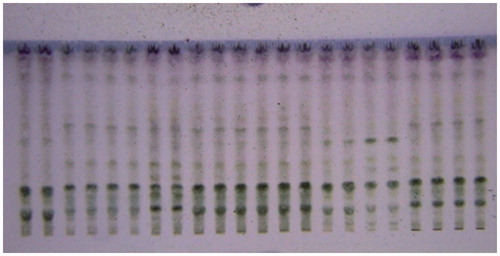
Figure 4. HPTLC chromatogram of different Stevia samples at 360 nm showing peaks of different metabolites.
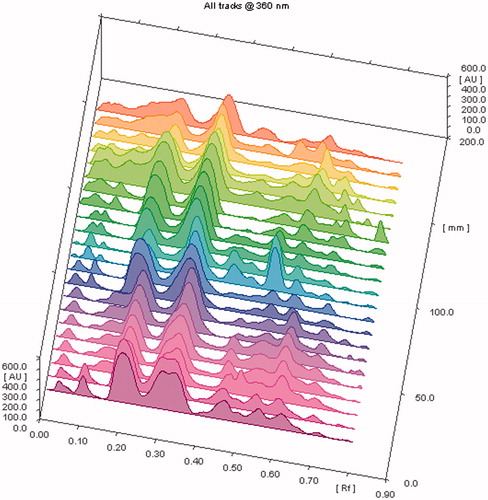
Table 6. Metabolic fingerprinting of S. rebaudiana using HPTLC showing number of spots and their Rf value data from different samples.
Table 7. Content of stevioside and rebaudioside A (mg/g) in different samples of Stevia.