Figures & data
Figure 1. The procedure of the different extracts of WCAW.
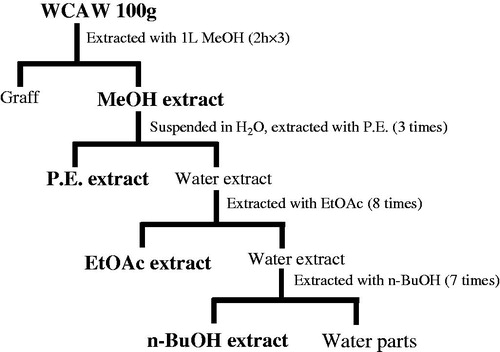
Figure 2. Effect of methanol extracts of WCAW (ME) and four extracts of ME on acetic acid-induced abdominal pain in mice. ME (200, 400 and 800 mg/kg, i.g.) and aspirin (100 mg/kg) reduced the number of writhings (A). P.E. (132 mg/kg i.g.), EtOAc (106 mg/kg i.g.), n-BuOH (176 mg/kg i.g.), H2O (176 mg/kg i.g.) and pethidine (2.5 mg/kg i.p.) also reduced the number of writhings (B). Pethidine increased the latency time of first writhing markedly, although WCAW had little effect. Each bar represents the mean ± S.E.M. of 10 mice per group. *p < 0.05, **p < 0.01, ***p < 0.001 indicate significant differences from the control group.
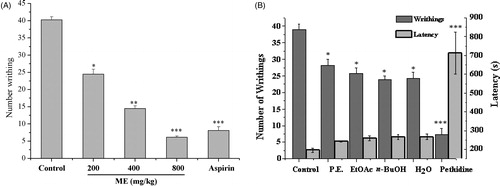
Figure 3. Effects of methanol extracts of WCAW (ME) and four extracts of ME on the formalin test in mice. ME (200, 400 and 800 mg/kg, i.g.) and pethidine (2.5 mg/kg i.p.) reduced the licking time (A). P.E. (132 mg/kg i.g.), EtOAc (106 mg/kg i.g.), n-BuOH (176 mg/kg i.g.), H2O (176 mg/kg i.g.) also reduced the licking time (B) and had different effect on the volume of hind paw (C). Each column represents the mean ± S.E.M. of 7 mice. *p < 0.05 and **p < 0.01 indicate significant differences from the control group.
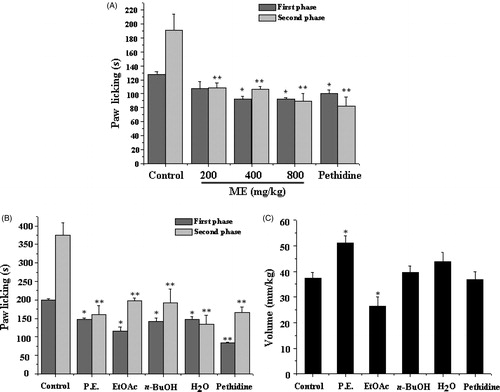
Figure 4. Effects induced by methanol extracts of WCAW (ME) (A), four different parts (B) and pethidine (2.5 mg/kg i.p.) on the nociceptive response induced by heat (hot-plate model, 55°С). Data represent the mean ± S.E.M. of 7–8 mice. *p < 0.05 and **p < 0.01 indicate significant differences from the control group.
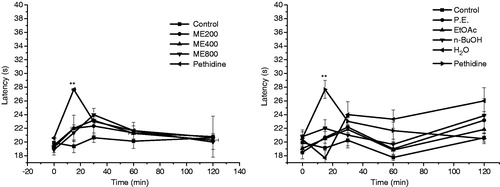
Figure 5. Chromatograms of WCA extract and its different polar fractions by HPLC-MS. (A) TIC chromatogram of ME in the positive ESI mode. (B) TIC chromatogram of ME in the negative ESI mode. (C) TIC chromatogram of the P.E. extract in the positive ESI mode. (D) TIC chromatogram of P.E. extract in the negative ESI mode. (E) TIC chromatogram of EtOAc extract in the positive ESI mode. (F) TIC chromatogram of EtOAc extract in the negative ESI mode. (G) TIC chromatogram of the n-BuOH extract in the positive ESI mode. (H) TIC chromatogram of the n-BuOH extract in the negative ESI mode.
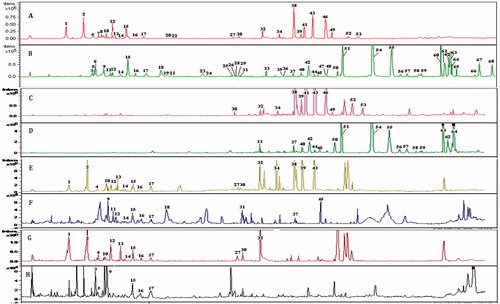
Table 1. HPLC-ESI(±)-MS data of analyses and distribution of the MeOH extract of WCAW and its fractions.