Figures & data
Table 1. Primer sequences and thermocycling conditions for RT-PCR.
Table 2. Initial and final body weight, food intake, liver weight, liver index (liver weight (g)/body weight (g) ×100) and the levels of lipids in plasma (mmol/l) and liver (mg/g tissue) of mice.
Figure 1. Gross appearance of liver. HFFD group (B) shows hepatomegaly and pale appearance compared to CON group (A). Liver from HFFD + GEN group (C) shows near-normal appearance. CON + GEN group (D) shows normal appearance of liver.
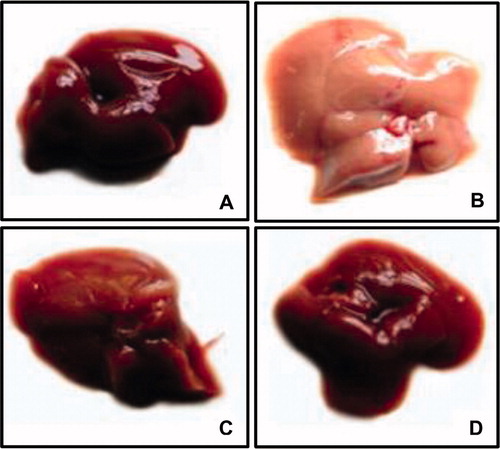
Figure 2. Representative liver sections stained with hematoxylin and eosin (40×) from each group. CON group (A) shows normal architecture of liver. HFFD group (B) shows large cytoplasmic lipid droplets (indicated by arrows) and ballooning degeneration (indicated by circle). HFFD + GEN group (C) shows less lipid vacuoles as compared to HFFD suggesting a reduction in lipid deposition. CON + GEN group (D) shows normal architecture of liver.
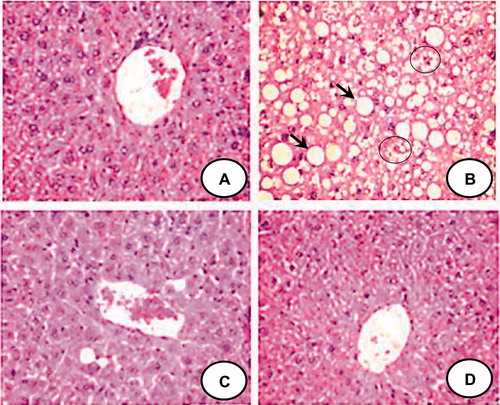
Figure 3. Representative images of the liver sections stained with oil Red O (40×) from each group. HFFD group (B) shows increased red staining suggesting increased fat accumulation. HFFD + GEN group (C) shows decreased red staining as compared to HFFD suggesting a reduction in lipid deposition. CON + GEN group (D) shows staining similar to CON group (A) of liver. Histograms (E) represent mean ± SD (three animals per group). Scale bar 1 cm = 200 µm. *p < 0.05 compared to control; †p < 0.05 compared to HFFD.
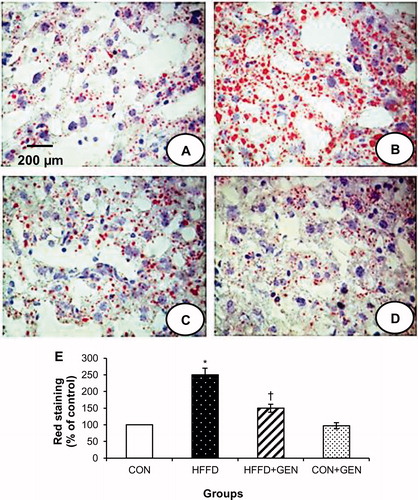
Figure 4. Effect of genistein on IR-β tyrosine phosphorylation in liver of experimental animals after insulin stimulation. The extent of IR-β tyrosine phosphorylation was assessed by the anti-phosphotyrosine western blot of IR-β immunoprecipitates. Blots were stripped of bound antibodies and re-probed with anti-IR-β antibody for normalization. Densitometric quantification of phosphotyrosine IR-β to IR-β is expressed as fold change with respect to control. Data are expressed as mean ± SD of six mice. IP, immunoprecipitation; IB, immunoblotting; *p < 0.05 compared to control; †p < 0.05 compared to HFFD.
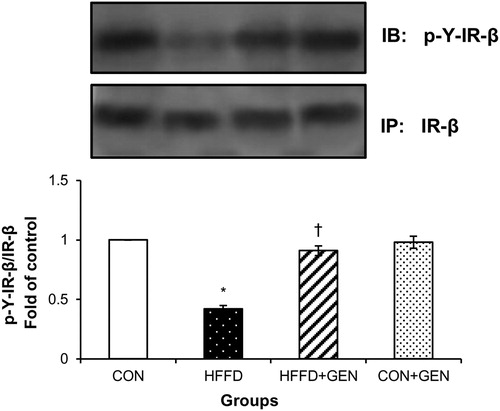
Figure 5. Effect of genistein on IRS-1 and 2 phosphorylation. (A and B) The effects of genistein on IRS-1 and 2 serine and tyrosine phosphorylation and p85PI3K association to IRS-1 and 2 in liver of experimental animals after insulin stimulation. The serine and tyrosine phosphorylation of IRS-1 or 2 and the association of IRS-1 or 2 with PI3K were assessed by anti-phosphoserine or anti-phosphotyrosine or p85PI3K western blot of IRS-1 or 2 immunoprecipitates. Blots were stripped of bound antibodies and re-probed with either anti-IRS-1 or 2 antibodies to normalize the blots for protein levels. Densitometric data of phosphoserine, phosphotyrosine and IRS-1 or 2/p85PI3K association to IRS-1 or 2 are expressed as fold change with respect to control. Data are expressed as mean ± SD of six mice. IP, immunoprecipitation; IB, immunoblotting; *p < 0.05 compared to control; †p < 0.05 compared to HFFD.
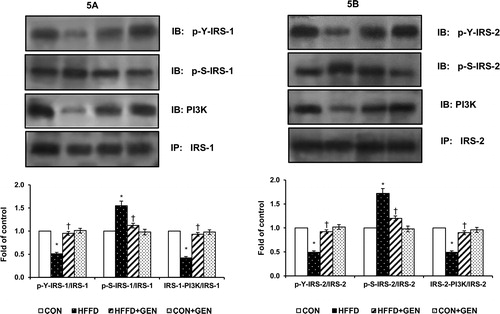
Figure 6. Effect of genistein on Akt phosphorylation in liver of experimental animals after insulin stimulation. For determining the extent of Akt activation, proteins were immunoblotted with phosphospecific anti-Ser473 Akt antibody. Blots were stripped and re-probed with anti-Akt antibody for normalization. Densitometric quantification of pAkt Ser473 to Akt is expressed as fold change with respect to control. Data are mean ± SD of six mice. IB, immunoblotting; *p < 0.05 compared to control; †p < 0.05 compared to HFFD.
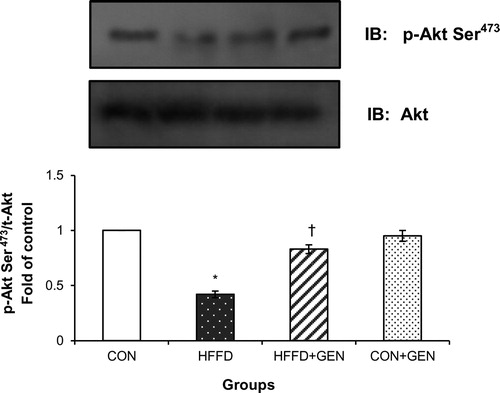
Figure 7. Effect of genistein on AMPK and S6K1 phosphorylation. (A) The effect of genistein on AMPK phosphorylation in liver of experimental animals. For determining the extent of AMPK activation, proteins were immunoblotted with phosphospecific anti-Thr172 AMPK antibody. Blots were stripped and re-probed with anti-AMPK antibody for normalization. Densitometric quantification of p-Thr172 AMPK to AMPK is expressed as fold change with respect to control. (B) The effect of genistein on S6K1 inhibition in liver of experimental animals. Proteins were immunoblotted with phosphospecific anti-Thr389 S6K1 antibody. Blots were stripped and re-probed with anti-S6K1 antibody to normalize for protein levels. Densitometric quantification of anti-Thr389 S6K1 to S6K1 are expressed as fold change with respect to control. Data are mean ± SD of six mice. IB, immunoblotting; *p < 0.05 compared to control; †p < 0.05 compared to HFFD.
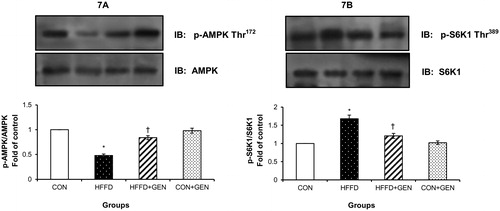
Figure 8. RT-PCR analysis of LXR-α (A), SREBP1c (B), FAS (C), ACC (D), SCD1 (E) and β-actin (F).The densitometry data for each band in an animal group was normalized with the corresponding β-actin in that group. The value obtained from each group was then expressed as fold change relative to control group. Lane 1: 100 bp DNA ladder; lane 2: CON; lane 3: HFFD; lane 4: HFFD + GEN and lane 5: CON + GEN. Data are expressed as mean ± SD of six mice. *p < 0.05 compared to control; †p < 0.05 compared to HFFD.
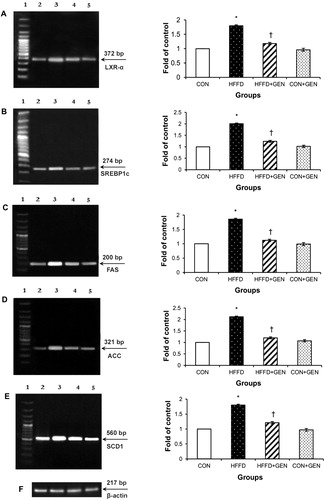
Figure 9. RT-PCR analysis of PPAR-α (A), ACO (B), UCP2 (C), CPT1 (D) and β-actin (E). The densitometry data for each band in an animal group were normalized with the corresponding β-actin in that group. The value obtained from each group was then expressed as fold change relative to control group. Lane 1: 100 bp DNA ladder; lane 2: CON; lane 3: HFFD; lane 4: HFFD + GEN and lane 5: CON + GEN. Data are expressed as mean ± SD of six mice. *p < 0.05 compared to control; †p < 0.05 compared to HFFD.
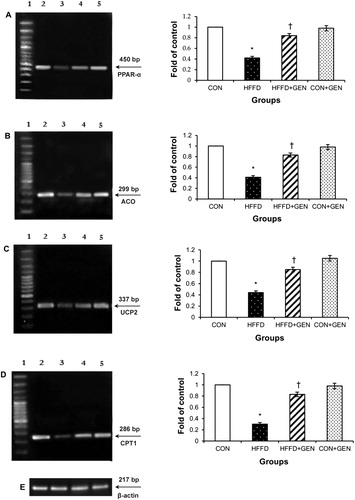
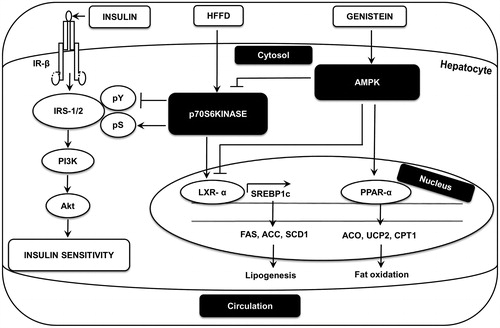
Figure 10. A schematic diagram illustrating the proposed mechanism for genistein’s action in liver. Genistein activates AMPK in liver. This activation inhibits HFFD-induced S6K1 activation and thereby improves insulin signaling in liver. Additionally, genistein limits lipogenesis by inhibiting LXR-α-SREBP1c and downregulates SREBP1c-dependent lipogeneic genes including FAS, ACC and SCD1. Further, genistein induces fat oxidation by upregulating PPAR-α, ACO, UCP2 and CPT1 genes.