Figures & data
Figure 1. The experimental design of von Frey, plantar and cold-plate tests.
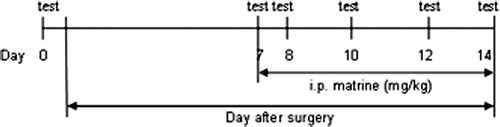
Figure 2. The experimental design of the rota-rod test and locomotor activity.
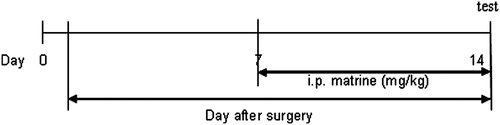
Figure 3. Effects of matrine on mechanical allodynia in von Frey test. Fifteen minutes after administration of matrine (7.5, 15 and 30 mg/kg), the paw withdrawal threshold (g) to von Frey filaments were measured at different time intervals (days 8, 10, 12, 14). Data were obtained seven days after surgery, and the mean ± SEM is shown, n = 10 per group. #p < 0.05 compared with the sham-operated group and *p < 0.05 versus the CCI group.
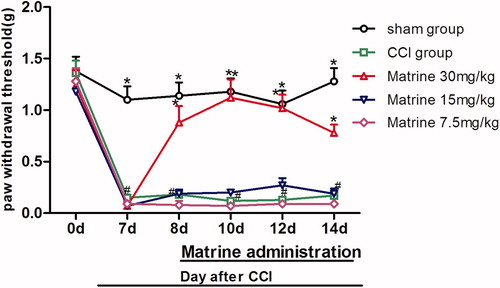
Figure 4. Effects of matrine on thermal hyperalgesia in the Plantar test. Fifteen minutes after administration of matrine (7.5, 15 and 30 mg/kg), the paw withdrawal latencies to radiant heat were measured at different time intervals (days 8, 10, 12, 14). Data were obtained seven days after surgery, and the mean ± SEM is shown, n = 10 per group. #p < 0.05 compared with the sham-operated group and *p < 0.05 versus the CCI group.
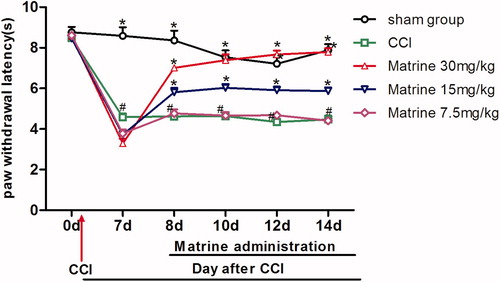
Figure 5. Effects of matrine on thermal allodynia in the cold-plate test. Fifteen minutes after administration of matrine (7.5, 15 and 30 mg/kg), the numbers of paw lifting from the cold plate were measured at different time intervals (days 8, 10, 12, 14). Data were obtained seven days after surgery, and the mean ± SEM is shown, n = 10 per group. #p < 0.05 compared with the sham-operated group and *p < 0.05 versus the CCI group.
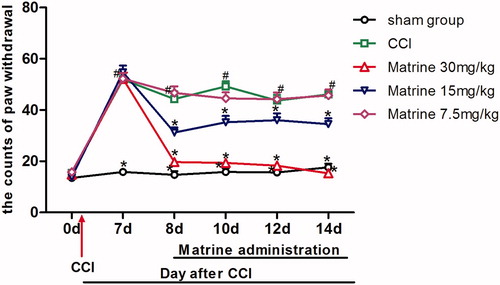
Figure 6. Effects of matrine on motor coordination test. Effects of matrine of different dosage on motor coordination test after chronic constriction of sciatic nerve, compared with the CCI group. Data are expressed as mean ± SEM, n = 10 per group.
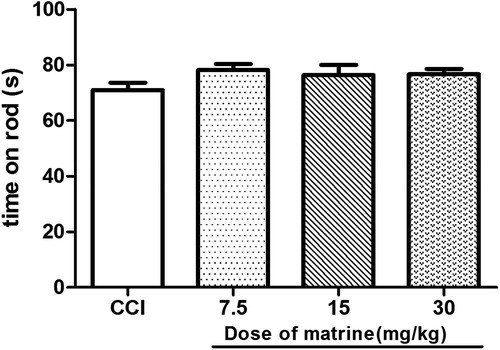
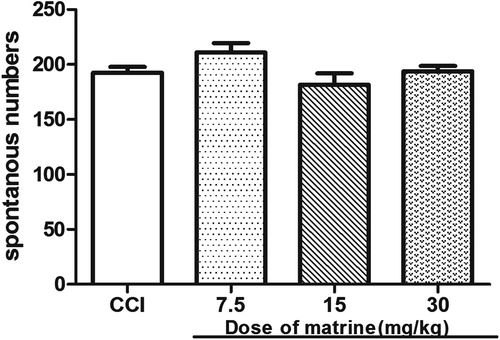
Figure 7. Effects of matrine on the spontaneous locomotor activity test. Effects of matrine of different dosage on spontaneous locomotor activity test after chronic constriction of sciatic nerve compared with the CCI group. Data are expressed as mean ± SEM, n = 10 per group.