Figures & data
Figure 1. Scheme for preparation of the active fractions from the methanol extract of the aerial parts of barley.
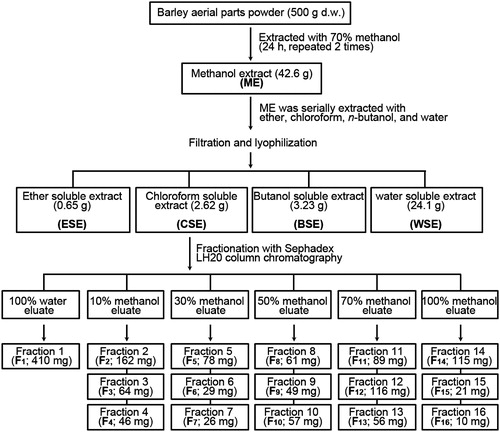
Figure 2. Effects of the serial extracts from the methanol extract of the aerial parts of barley on the NO production in LPS-stimulated RAW 264.7 cells. The cells were incubated for 48 h with 100 μg/mL of each extract in the presence of 1 μg/mL LPS and the levels of NO in the conditioned media were measured. *p < 0.05 and **p < 0.01 versus the LPS treatment alone.
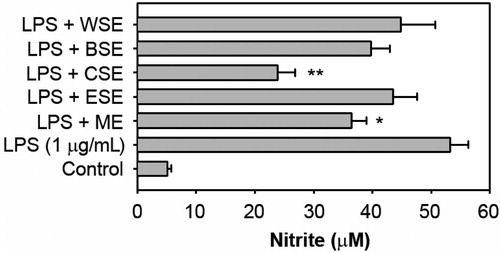
Figure 3. Effects of the sub-fractions eluted from the chloroform soluble extract on the NO production and iNOS induction in LPS-stimulated RAW 264.7 cells. (A) The cells were incubated for 48 h with 100 μg/mL of each fraction in the presence of 1 μg/mL LPS and the levels of NO in the conditioned media were determined. *p < 0.05, **p < 0.01 and ***p < 0.001 versus the LPS treatment alone. (B) The cells were also treated with 100 μg/mL of each of the four active fractions in the presence of 1 μg/mL LPS for 24 h and then whole protein lysates from the cells were analyzed by Western blot analysis. The level of the iNOS protein was measured by densitometric analysis after normalizing it to that of β-actin. ***p < 0.001 versus the non-treated control cells. ###p < 0.001 versus the LPS treatment alone.
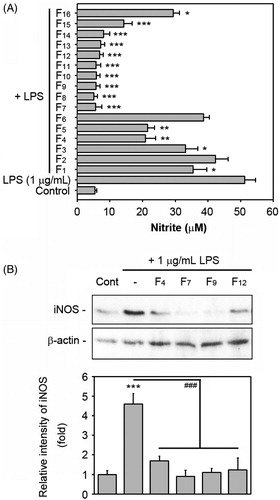
Figure 4. Effects of the fractions F4, F7, F9 and F12 on the production of pro-inflammatory cytokines in LPS-stimulated RAW 264.7 cells. The cells were stimulated with 1 μg/mL LPS in the presence and absence of 100 μg/mL of each fraction. After 48 h of co-incubation, the levels of TNF-α, IL-6 and IL-1β in the culture supernatants were measured by ELISA. The data represent the mean values of three independent experiments. ***p < 0.001 versus the non-treated control cells. #p < 0.05, ##p < 0.01 and ###p < 0.001 versus the LPS treatment alone. ND = non-detectable.
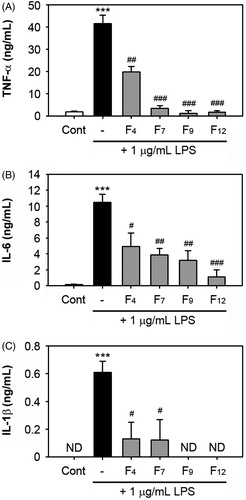
Figure 5. Effects of the four active fractions on NF-κB DNA binding in LPS-stimulated RAW 264.7 cells. The cells were pre-treated with 100 μg/mL of each fraction for 1 h just before stimulation with 1 μg/mL LPS. After 1 h of stimulation, nuclear fractions were prepared from the cells and processed for the analyses of NF-κB binding activity by EMSA (A) and non-isotopic enzymatic assay (B). The results from the EMSA show a representative result from three different experiments. ***p < 0.001 versus the non-treated control cells. #p < 0.05 and ##p < 0.01 versus the LPS treatment alone.
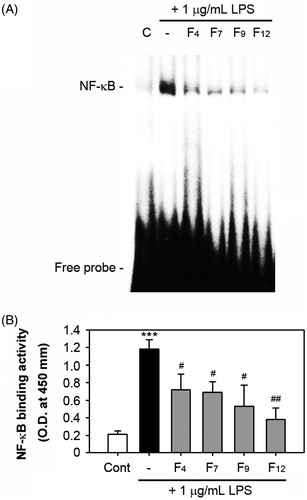
Figure 6. Protective effects of the active fractions of barley in a murine sepsis model. As described in the materials and methods section, mice were injected with LPS (30 mg/kg BW) as an experimental sepsis model. The effects of the co-administration with the fractions F4, F7, F9 and F12, on survival rate were analyzed every 6 h after LPS injection for 4 d.
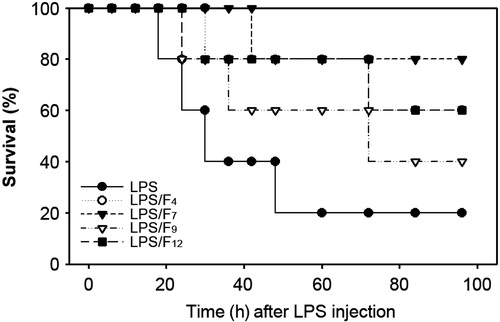
Figure 7. Modulation of the serum cytokine concentrations by oral administration of the active fractions of barley in a murine sepsis model. The sera from the mice that were orally administered each fraction were collected 2 and 8 h after the LPS injection and processed in order to determine the serum levels of TNF-α, IL-6 and IL-1β. #p < 0.05 and ##p < 0.01 versus the mice injected with LPS only. ND = non-detectable.
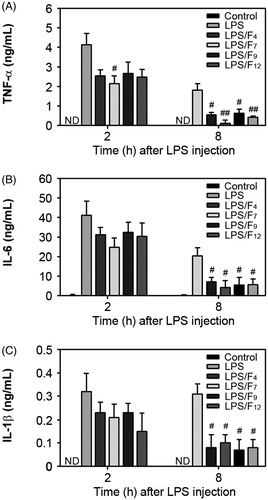
Figure 8. The structures of the 15 identified compounds in the four active fractions isolated from the methanol extract of the aerial parts of barley.
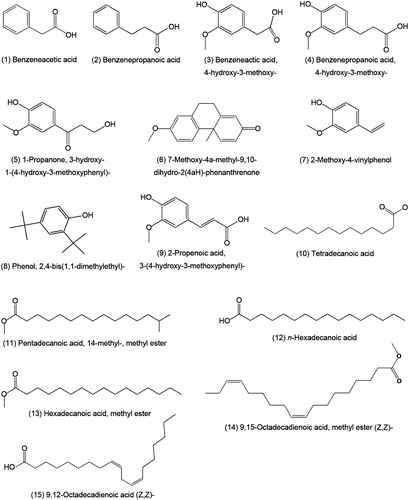
Table 1. The main compounds identified in the four active fractions isolated from barley aerial part methanol extract.