Figures & data
Figure 1. Fingerprinting analysis. Dissolution of water extract of A. xanthoides (WAX) and standard were filtered and subjected to HPLC analysis. (A) Standard: Quercitrin 2.5 mg/mL, 10 µL, (B) WAX 20 mg/mL, 10 µL.
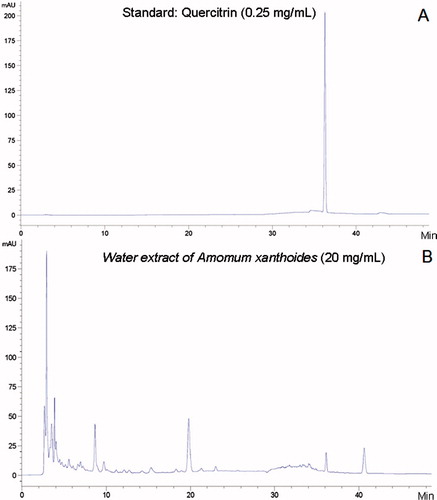
Figure 2. Histopathological and immunohistochemical analysis. After injection of DMN (10 mg/kg), SD rats were treated with WAX (50, 100 mg/kg), DDB (25 mg/kg), or distilled water every day. Liver tissue sections fixed in Bouin’s solution were stained with H&E (A) or Masson’s trichrome (B), and subjected to immunohistochemical analysis of α-SMA (C). Histological analyses were performed at 200× magnification under an optical microscope. Solid arrows indicate necrotic hepatocyte, while the hollow arrows indicate inflammatory cell infiltration. The intensity of necroinflammation was graded as none, mild, moderate and severe (D). The percent area of the fibrotic region (E) and the α-SMA staining region (F) were analyzed by Image J software. Data were shown as mean ± SD; ##p < 0.01, compared to the normal group; **p < 0.01 compared to the DMN group (n = 8).
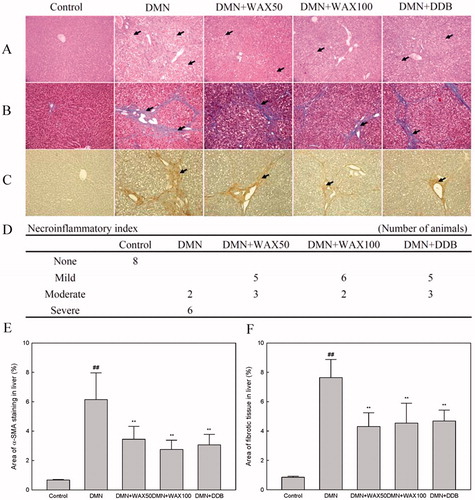
Table 1. Body/organ weights and biochemistry parameters.