Figures & data
Figure 1. Fitting centers used for overlapping chalcones.
Table 1. The brine shrimp cytotoxicity of the synthesized chalcones. 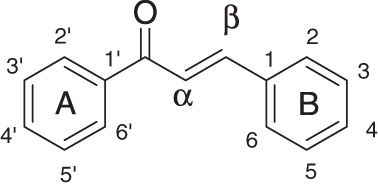 .
.
Table 2. Observed and predicted pLC50 of the training set compounds.
Table 3. Observed and predicted pLC50 of the test set compounds.
Figure 2. Calculated versus observed activity of the training set compounds.
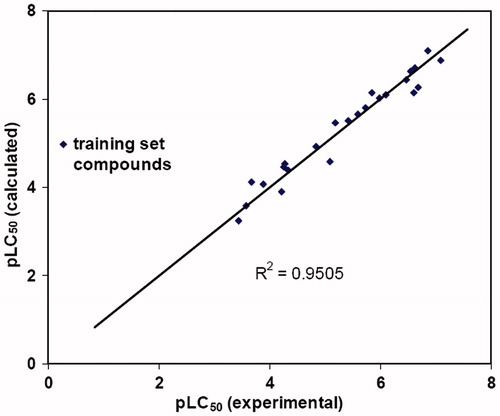
Figure 3. Calculated versus observed activity of the test set compounds.
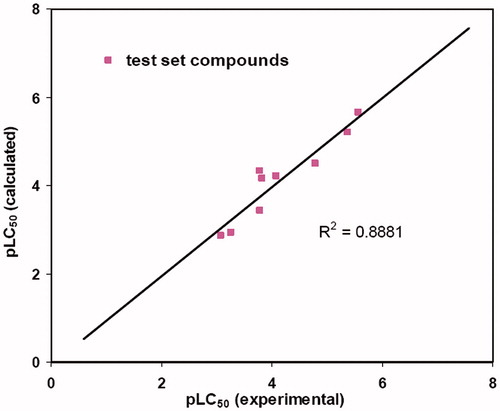
Figure 4. Stereoview of the CoMFA map for the electronic and steric contributions favoring activity.
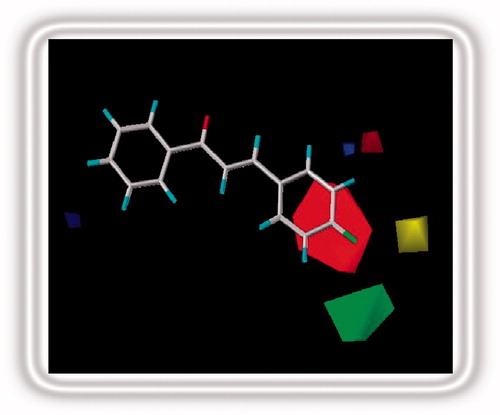
Figure 5. Favorable electronic and steric regions for enhanced potency in cytotoxic chalcones.
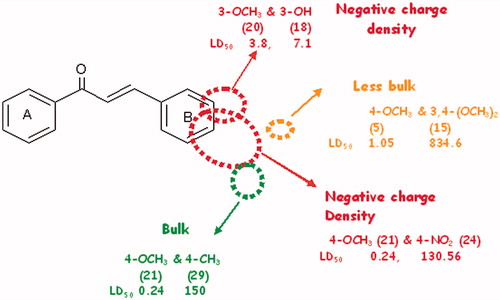
Table 4. Predicted pLC50 of the designed chalcones.
Figure 6. Chalcone 34 bound into the binding pocket of tubulin active site.
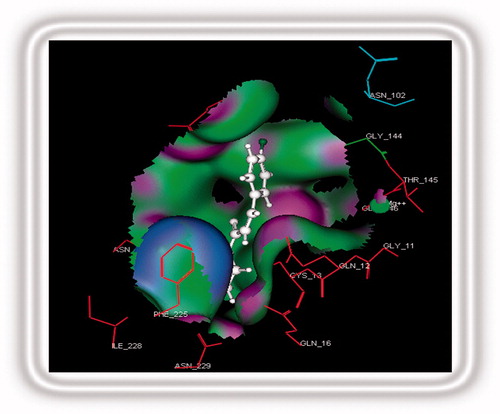
Table 5. The energy scores (kCal mol−1) of designed inhibitors.
Table 6. The predicted and observed pLC50 values of the designed chalcone analogues.
Figure 7. Cytotoxicity of chalcones 34–38 against human squamous cell carcinoma (H157), malignant melanoma of skin (HT144), breast cancer (MCF7), colon cancer (SKCO1), liver cancer (HepG2) and lung carcinoma (H1299).
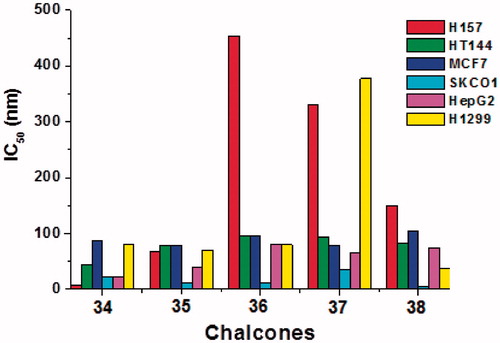
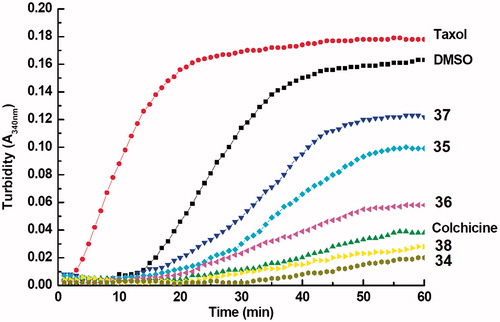
Figure 8. Tubulin polymerization activity of 5 μM of each of designed chalcones 34–38 on tubulin polymerization. Taxol and colchicine (5 μM) used as reference compounds whereas DMSO was used as control. The activity was assessed by turbidity change using UV-VIS spectrophotometry.