Figures & data
Figure 1. Antimitogenic activity of SA on human colorectal cancer and normal human fibroblast cells. (a) Time- and dose-dependent antimitogenic effect of SA on cancer cell lines SW1116 and SW837 and normal human fibroblast CRL1554, (b) Morphological changes of cancer cells treated with SA, (c) Colony formation by untreated and SA-treated cancer cell lines.
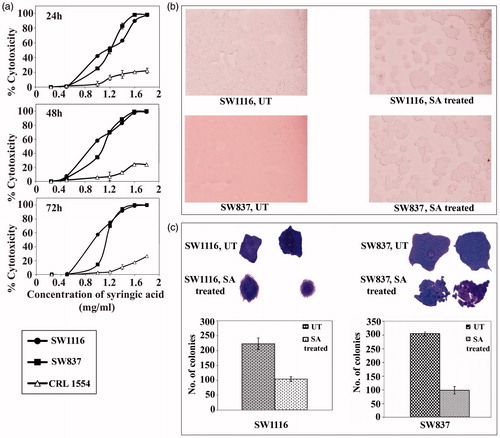
Figure 2. Analysis of cell cycle of cancer cells treated with SA. Cancer cell lines SW1116 and SW837 were processed as previously described (Abaza et al., Citation2008a). At least three samples were analyzed and 20 000 events were scored for each sample. The vertical axis represents the relative number of events and the horizontal axis represents the fluorescence intensity.
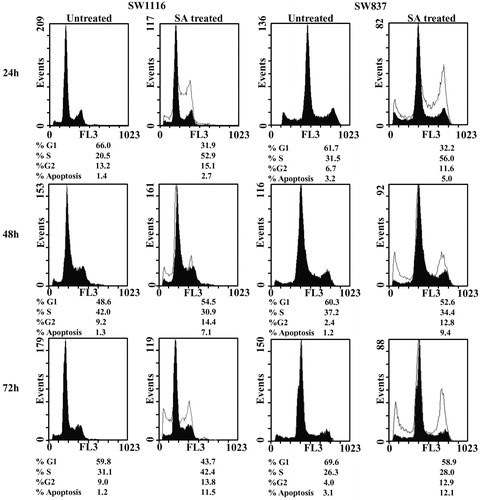
Figure 3. Assessment of apoptosis, NFκB activity and proteasome activities in cancer cells treated with SA. (a) Assessment of apoptosis. B1: percentage of necrotic cells, B2: percentage of late apoptotic cells, B3: percentage of living cells and B4: percentage of early apoptotic cells. (b) Monitoring the NFκ-B activity in nuclear extracts of cancer cells, (c) monitoring the 26S proteasomal activities in cancer cell extracts.
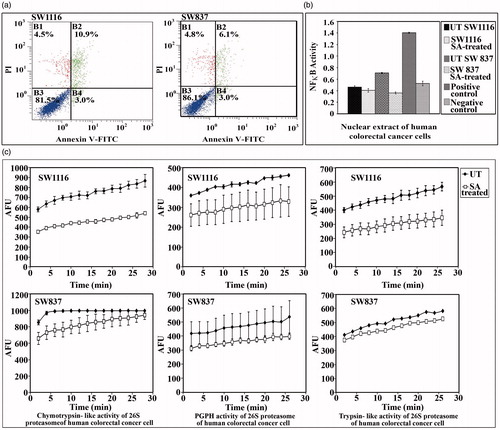
Figure 4. Anti-invasive potential of SA in human colorectal cancer cell lines. Invasion assay was conducted according to the manufacturer’s instructions (Cell Invasion Assay Kit, Chemicon International Inc) as described under the “Materials and methods” section.
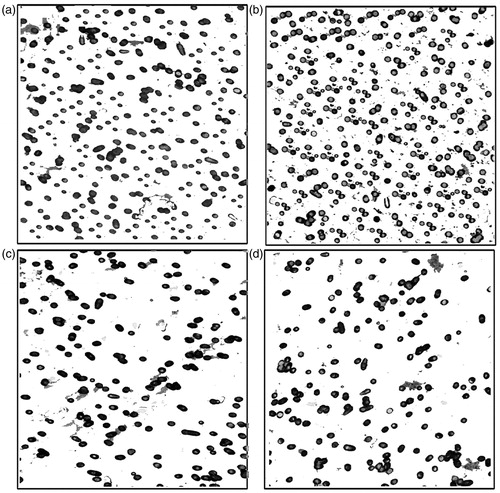
Figure 5. Assessment of the mRNA expression of the genes controlling cell cycle and apoptosis in cancer cells-treated with SA. (a) Assessment of the mRNA expression of cyclin-dependent kinase, cyclin and cyclin-dependent kinase inhibitors genes in cancer cell line SW1116 treated with SA. (b) Assessment of the mRNA expression of pro-apoptotic, anti-apoptotic and caspase genes in cancer cell line SW1116-treated with SA.
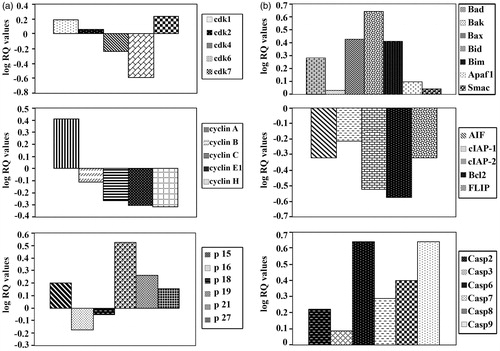
Table 1. IC50, IC70, IC80 values, sensitization ratios and P-values of the combined treatment with SA and standard chemotherapeutic drugs in human colorectal cancer cell line SW1116.
Table 2. IC50–IC80, sensitization ratios and p-values of the combined treatment with SA and standard chemotherapeutic drugs in human colorectal cancer cell line SW837.
Table 3. Analysis of the combined effects of SA and standard chemotherapeutical drugs on human colorectal cell lines.
Table 4. Analysis of the combined effects of SA and conventional chemotherapeutical drugs on human colorectal cell lines.
Figure 6. SA potentiates the cytotoxicity of standard chemotherapeutic drugs on cancer cell line SW1116. Cancer cells SW1116 were plated into a 96-well plate at 37 °C in a non-CO2 incubator. 18 h after starting the culture, the cells were treated for 24 h with various concentrations of chemotherapies. Then the drug was removed and the cells were washed, treated with SA for 48 h and cell proliferation was monitored by the MTT assay.
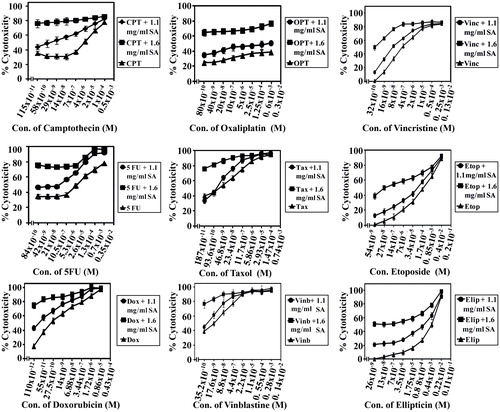
Figure 7. SA potentiates the cytotoxicity of conventional chemotherapeutic drugs on cancer cell line SW837. Cancer cells SW837 were plated into a 96-well plate at 37 °C in a non-CO2 incubator. 18 h after starting the culture, the cells were treated for 24 h with various concentrations of chemotherapies. Then the drug was removed and the cells were washed, treated with SA for 48 h and cell proliferation was monitored by MTT assay.
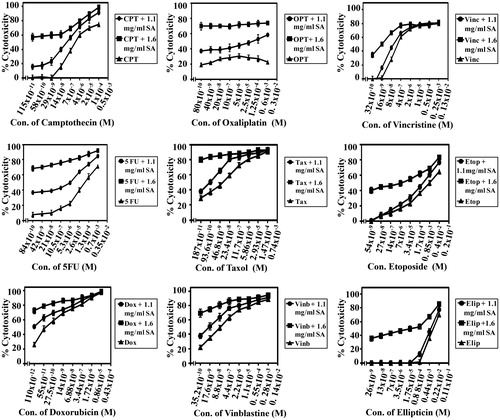
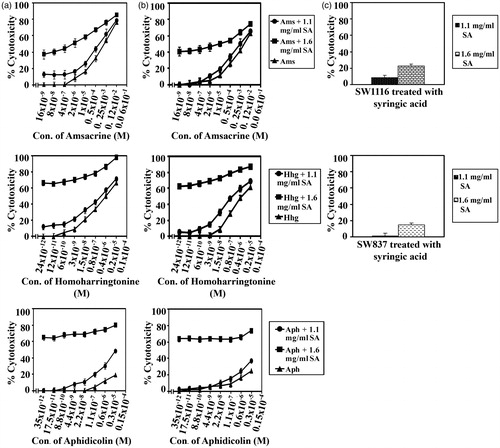
Figure 8. SA potentiates the cytotoxicity of amsacrine, homohorrigtonine and aphidicolin on cancer cell lines SW1116 and SW837. Cancer cell lines SW1116 (a) and SW837 (b) were plated into 96-well plates. 18 h after starting the culture, the cells were treated for 24 h with various concentrations of amsacrine, homoharrigtonine and aphidicolin. Then the drug was removed and the cells were washed, treated with SA for 48 h and cell proliferation was monitored by the MTT assay. The effect of SA alone on the growth of SW1116 and SW837 was also evaluated (c).