Figures & data
Figure 1. The structure of compounds 1–7.
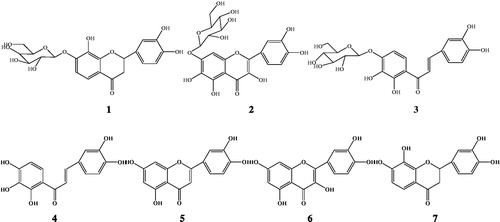
Figure 2. Vasorelaxation effects of CTAD and CTAE in endothelium-denude (E−) aortic rings that were pre-contracted with KCl (60 mM, A) or PE (1 µΜ, B). **p < 0.01, *p < 0.05 with the control group. CTAD and CTAE: 50% and 70% ethanol eluates of ethanol extracts from C. tinctoria with AB-8 resin, respectively. Values are means ± SD (n = 10), expressed as the percentage of the vascular tension induced by KCl (60 mM) or PE (1 µΜ).
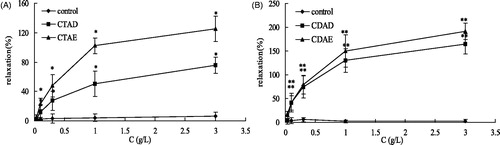
Table 1. Vasorelaxant effects of extracts from C. tinctoria against high K+-induced contractions in rat aortic rings.
Figure 3. Concentration-dependent effects of flavanomarein, querceagetin 7-O-β-d-glucoside, marein, okanin, luteolin, quercetin and dihydromelanoxetin on intact rat aorta rings precontracted with KCl (μM). **p < 0.01, *p < 0.05 with the control group. Values are means ± SD (n = 10 rings).
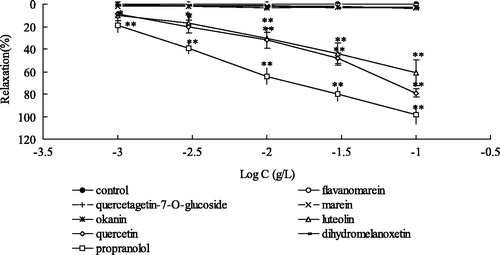
Figure 4. Concentration-dependent effects of quercetin, luteolin and propranolol on intact rat aorta rings precontracted with PE 1 μM. **p < 0.01, *p < 0.05 with control group. Values are means ± SD (n = 10 rings).
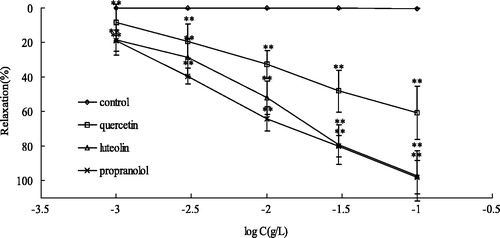
Figure 5. Effects of CTAD and CTAE (3 g/L) on the dose–response curve of the percentage contraction in high K+–Ca2+-free depolarizing solution and cumulative concentration of CaCl2 (0.25 mM–5.00 mM). **p < 0.01, *p < 0.05 with the control group. CTAD and CTAE: 50% and 70% ethanol eluates of ethanol extracts from C. tinctoria with AB-8 resin, respectively. *p < 0.05 compared with control group (n = 10 rings).
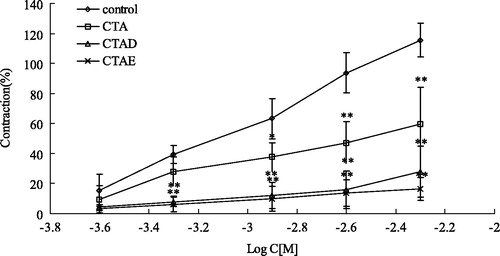
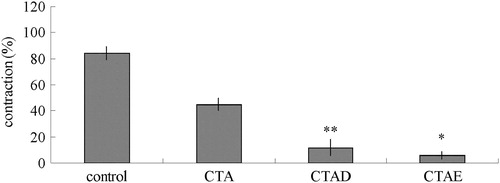
Figure 6. Effects of CTA, CTAD and CTAE on PE-induced transient contractions in Ca2+-free solution. **p < 0.01, *p < 0.05 with the control group. CTA: ethanol extracts from C. tinctoria, CTAD and CTAE were 50% and 70% ethanol eluates of CTA with AB-8 resin, respectively. Values represent mean ± SD of 10 determinations.