Figures & data
Table 1. The comparison of fatty acids in diet and total fatty acids is about 6.8 % in diet.
Table 2. The effects of DHA on fatty acid composition in hippocampus tissues (% of total).
Table 3. The effects of DHA on superoxide dismutase (SOD), glutathione peroxidase (GSH-Px), catalase (CAT) and thiobarbituric acid reactive substances (TBARS) in hippocampus tissues.
Table 4. Effect of DHA on GDNF levels in hippocampus tissues.
Figure 1. GFRa1 mRNA and protein level in the hippocampus tissue. Rat treatment with 80 mg/kg/day and 160 mg/kg/day DHA 50 days significantly influence the expression of GFRa1 in hippocampus tissue. Summary of the results derived from real-time RT-PCR. GFRa1 mRNA levels were first normalized to GAPDH, calculated by the 2–ΔΔCT method. Relative expression units were determined by dividing the apparent levels of by the expression level of adult group. Compared with the aged rats, the treatment with 80 mg/kg/day and 160 mg/kg/day DHA 50 days significantly increased the protein expression of GFRα1. The quantity of the applied protein was normalized by Western blotting analysis with anti-actin polyclonal (n = 5). aap < 0.05 versus aged group. bbp < 0.01, DHA treatment group versus aged group. n = 5 in each group.
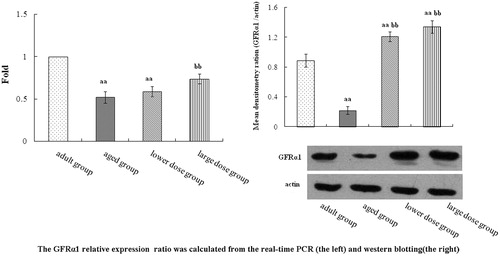
Figure 2. Western blot analysis of phosphorylation of receptor tyrosine kinase RET expression in the hippocampus tissue. Compared with aged rats treatment with 80 mg/kg/day and 160 mg/kg/day DHA 50 days significantly increased the protein expression of phosphorylation of receptor tyrosine kinase RET. The quantity of the applied protein was normalized by Western analysis with anti-RET (n = 5). aap < 0.05 versus aged group. bbp < 0.01, DHA treatment group versus aged group. n = 5 in each group.
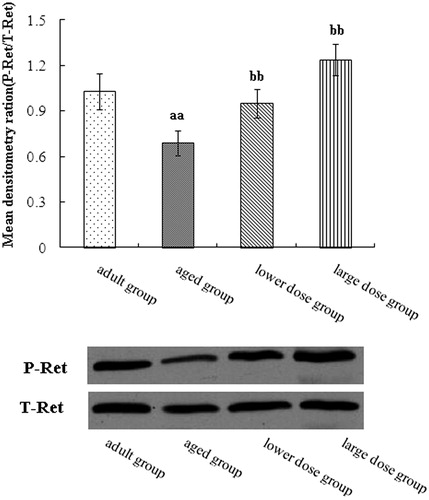
Figure 3. Western blot analysis of phosphorylation Raf expression in hippocampus tissue. Compared with aged rats, treatment with 80 mg/kg/day and 160 mg/kg/day DHA 50 days significantly increased the levels protein expression of phosphorylation of Raf. The quantity of the applied protein was normalized by Western analysis with anti-Raf (n = 5). aap < 0.05 versus aged group. bbp < 0.01, DHA treatment group versus aged group. n = 5 in each group.
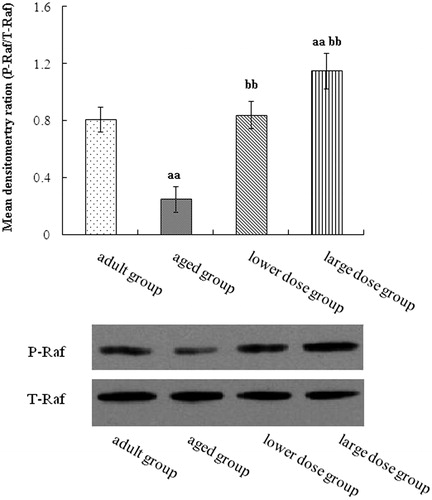
Figure 4. Western blot analysis of phosphorylation MEK expression in hippocampus tissue. Compared with aged rats, treatment with 80 mg/kg/day and 160 mg/kg/day DHA 50 days significantly increased the levels protein expression of phosphorylation of MEK. The quantity of the applied protein was normalized by Western analysis with anti-total MEK (n = 5). aap < 0.05 versus aged group. bbp < 0.01, DHA treatment group versus aged group. n = 5 in each group.
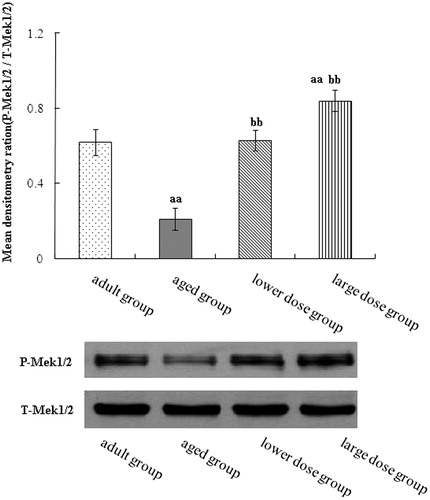
Figure 5. Western blot analysis of phosphorylation ERK expression in hippocampus tissue. Compared with aged rats, treatment with 80 mg/kg/day and 160 mg/kg/day DHA 50 days significantly increased the levels protein expression of phosphorylation of EEK. The quantity of the applied protein was normalized by Western analysis with anti-total ERK (n = 5). aap < 0.05 versus aged group. bbp < 0.01, DHA treatment group versus aged group. n = 5 in each group.
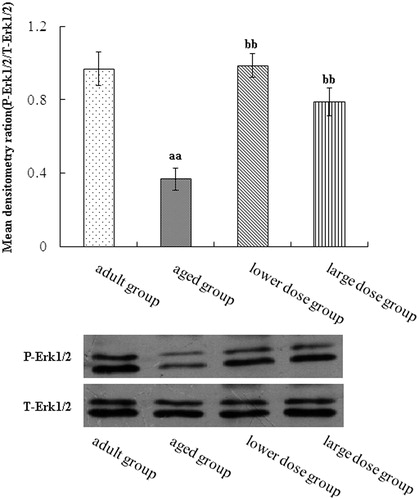
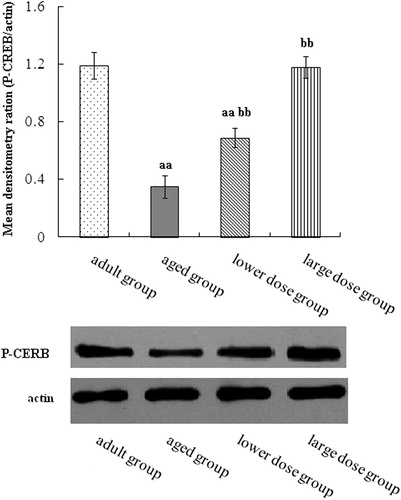
Figure 6. Western blot analysis of phosphorylation CERB expression in hippocampus tissue. Compared with aged rats, treatment with 80 mg/kg/day and 160 mg/kg/day DHA 50 days significantly increased the levels protein expression of phosphorylation of CERB. The quantity of the applied protein was normalized by Western analysis with actin. aap < 0.05 versus aged group. bb p < 0.01, DHA treatment group versus aged group. n = 5 in each group.