Figures & data
Table 1. Source and identification code of the analysed samples.
Figure 1. Chemical structures of the detected bioactive compounds.
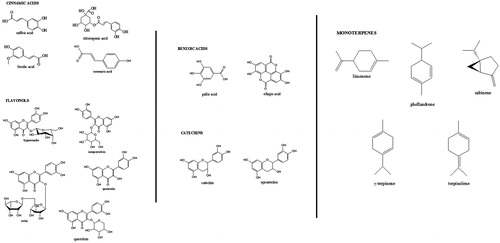
Table 2. Calibration curve equations, R2, LOD and LOQ of the used chromatographic methods for each calibration standard.
Figure 2. HPLC/DAD R. nigrum bud-preparation polyphenolic profile.
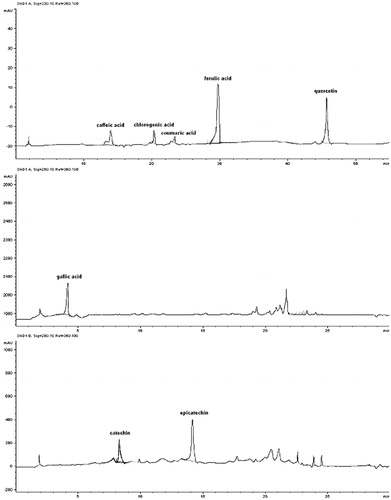
Figure 3. HPLC/DAD R. nigrum bud-preparation terpenic profile.
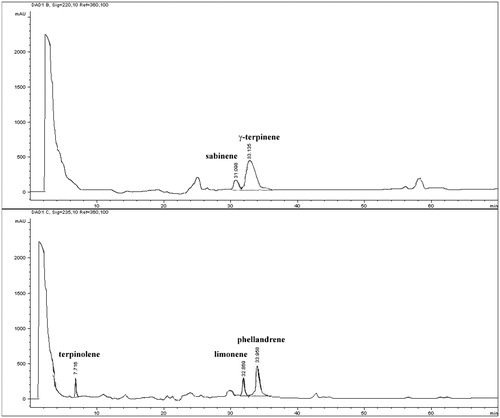
Figure 4. TBCC in University lab and commercial bud-preparations. Different letters for each sample indicate the significant differences at p < 0.05.
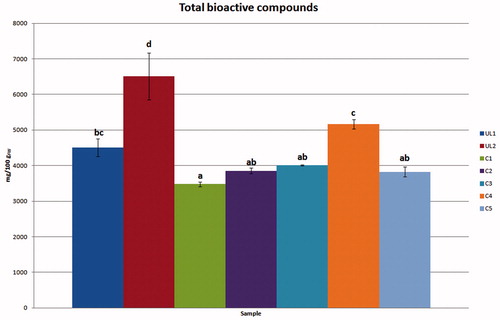
Figure 5. PCA individual graph of bud-preparation samples.
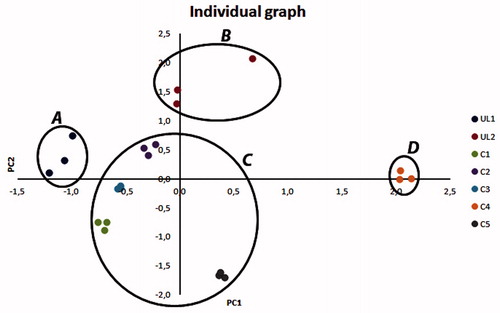
Figure 6. PCA variable graph of bud-preparation samples.
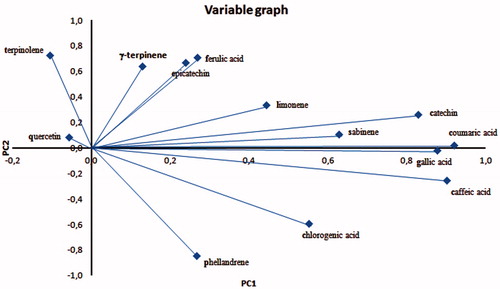
Table 3. Single polyphenolic profile of University bud–preparations and commercial bud–preparations (method A).
Table 4. Single polyphenolic profile of University bud-preparations and commercial bud–preparations (method B).
Table 5. Single terpenic profile of University bud–preparations and commercial bud–preparations (method C).
Table 6. Contribution (%) of botanical classes to the phytocomplex in analysed R. nigrum bud-preparations.