Figures & data
Figure 1. Structure of magnesium lithospermate B (MLB).
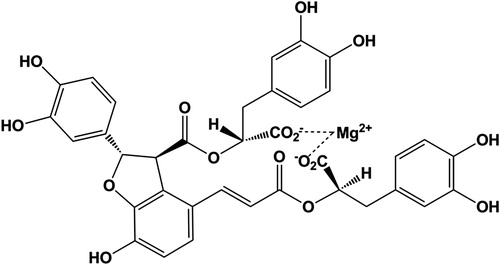
Figure 2. Effect of MLB on ST elevation. (A) Electrocardiogram observation during the course from anesthesia (before ligation), ischemia to reperfusion. (B) Effect of MLB on ST elevation. Myocardial ischemia/reperfusion; MLB, magnesium lithospermate B. n = 8; values are expressed as the mean ± S.D. Significance was determined by ANOVA followed by Tukey’s test. #p < 0.05 versus Sham group; *p < 0.05 versus MI/R + vehicle group.
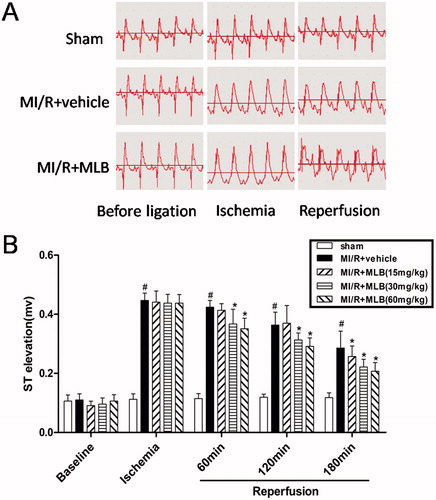
Figure 3. Effect of MLB on myocardial infarct size. (A) Myocardial risk and infarct area were determined by Evans blue and TTC method. (B) The effect of MLB administration on RZ (% TV) in rat after MI/R. (C) The effect of MLB administration on IZ (% RZ) in rat after MI/R. TV, total LV; RZ, risk zone; IZ, infarct zone; MI/R, myocardial ischemia/reperfusion; MLB, magnesium lithospermate B. n = 8; values are expressed as the mean ± S.D. Significance was determined by ANOVA followed by Tukey’s test. *p < 0.05 versus MI/R + vehicle group.
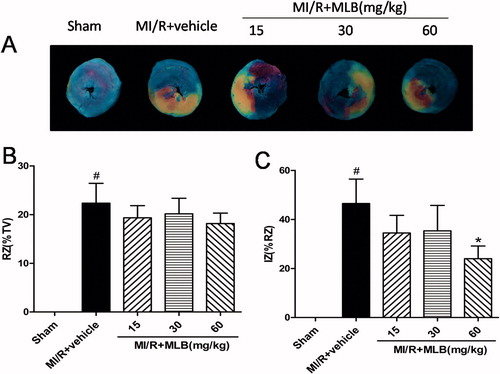
Table 1. Effect of MLB on the levels of CK-MB and cTnI in serum.
Table 2. Effect of MLB on the levels of IL-1β, IL-6 and TNF-α in serum.
Figure 4. Effect of MLB in MPO activity. MI/R, myocardial ischemia/reperfusion; MLB, magnesium lithospermate B. n = 8; values are expressed as the mean ± S.D. Significance was determined by ANOVA followed by Tukey’s test. # p < 0.05 versus Sham group; *p < 0.05 versus MI/R + vehicle group.
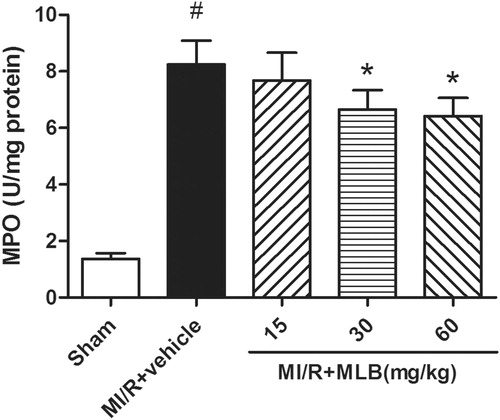
Figure 5. Histopathological changes in rat cardiac tissue (H&E × 400). (A) Sham group, (B) MI/R + vehicle group, (C) MI/R + MLB (15 mg/kg) group, (D) MI/R + MLB (30 mg/kg) group, (E) MI/R + MLB (60 mg/kg) group, (F) Histopathological scores. MI/R, myocardial ischemia/reperfusion; MLB, magnesium lithospermate B. n = 8; values are expressed as the mean ± S.D. Significance was determined by ANOVA followed by Tukey’s test. # p < 0.05 versus Sham group; *p < 0.05 versus MI/R + vehicle group.
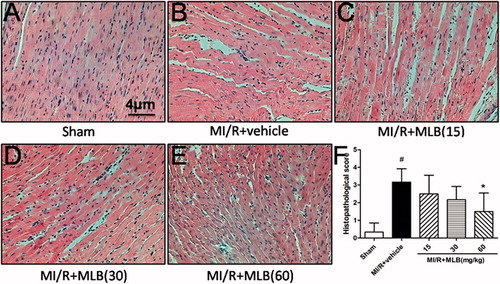
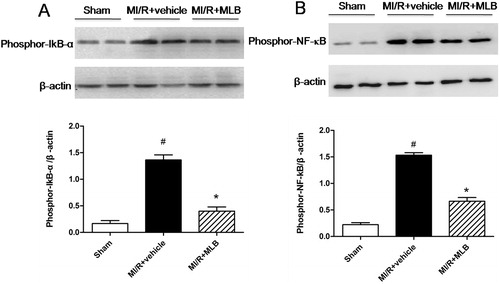
Figure 6. Effect of MLB on protein expression of phosporylation of IkB-α and NF-κB in MI/R injury rats. (A) Phosporylation of IkB-α was analyzed by western blot. Graphs showing the protein ratio of phospor-IkB-α/β-actin. (B) Phosporylation of NF-κB was analyzed by western blot. Graphs showing the protein ratio of phospor-NF-κB/β-actin. MI/R, myocardial ischemia/reperfusion; MLB, magnesium lithospermate B. Values are expressed as the mean ± S.D. Significance was determined by ANOVA followed by Tukey’s test. # p < 0.05 versus Sham group; *p < 0.05 versus MI/R + vehicle group.