Figures & data
Figure 1. Protocol of animal treatment for the evaluation of protective effect of AECa and MEBa against maneb toxicity. 2% SS: 2% starch solution, 10 ml/kg; 0.9% NaCl: NaCl 0.9%, 10 mL/kg bwt; MEBa: methanol extract of B. alba, 1 mg/kg; AECa: extract of C. alba, 0.1 mg/kg bwt.
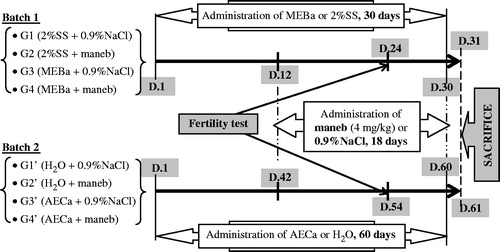
Figure 2. Relative body weight of male rats treated with MEBa (A)/AECa (B) and/or maneb. The first batch of male rats was administered MEBa and/or 2% SS for 30 days (A), while the second batch received AECa and/or distilled water for 60 days (B). Maneb and 0.9% NaCl were administered during the 18 last days of the experiment. Relative body weight of each animal was determined using the formula ((At/A0) × 100%: At and A0 represent the animal body weight at the time considered, and at the beginning of the experiment, respectively). Each data point represents the mean ± SD of five animals.
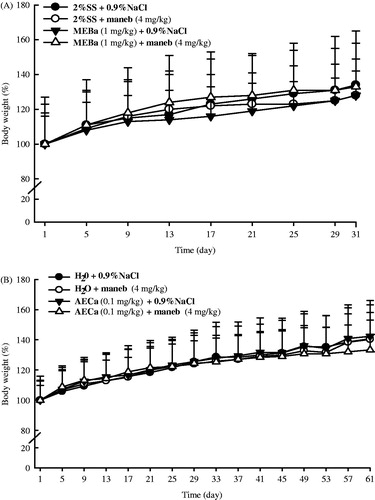
Figure 3. Relative organ weights of male rats following treatment with MEBa (A)/AECa (B) and/or maneb. The first batch of male rats was administered MEBa and/or 2% SS for 30 days (A), while the second batch received AECa and/or distilled water for 60 days (B). Maneb and 0.9% NaCl were administered during the 18 last days of the experiment. Relative body weight of each organ was determined using the formula ((b/B) × 100%: b and B represent the organ weight and animal body weight, respectively). Each data point represents the mean ± SD of five animals.
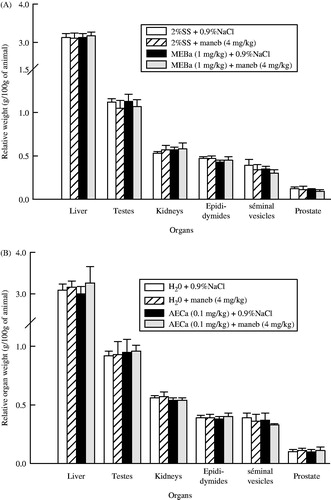
Table 1. Fecundity and fertility indices of male rats treated with MEBa (A)/AECa (B) and/or maneb.
Figure 4. Liver TBARS and GSH levels after treatment of male rats with MEBa (A)/AECa (B) and/or maneb. The first batch of male rats was administered MEBa and/or 2% SS for 30 days (A), while the second batch received AECa and/or distilled water for 60 days (B). Maneb and 0.9% NaCl were administered during the 18 last days of the experiment. The levels of thiobarbituric acid reactive substances (TBARS) and glutathione (GSH) are expressed as mean ± SD of five animals.
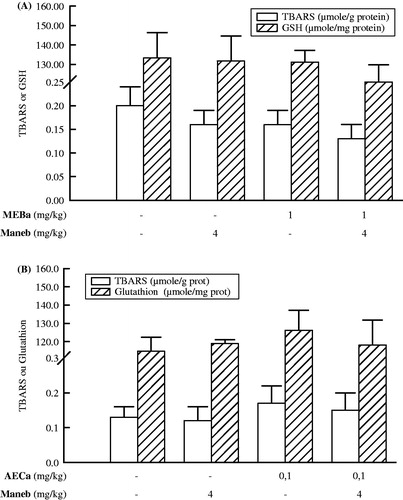
Table 2. Serum alanine aminotransferase activity (ALT) of male rats following evaluation of the protective effect of MEBa (A) and AECa (B).
Figure 5. Serum androstenedione levels in male rats treated with MEBa (A)/AECa (B) and/or maneb. The first batch of male rats was administered MEBa and/or 2% SS for 30 days (A), while the second batch received AECa and/or distilled water for 60 days (B). Maneb and 0.9% NaCl were administered during the 18 last days of the experiment. Data are expressed as mean ± SD of five animals per group. *p < 0.01, compared with the corresponding control group (group receiving neither plant extract nor maneb) (Student–Newman–Keuls test).
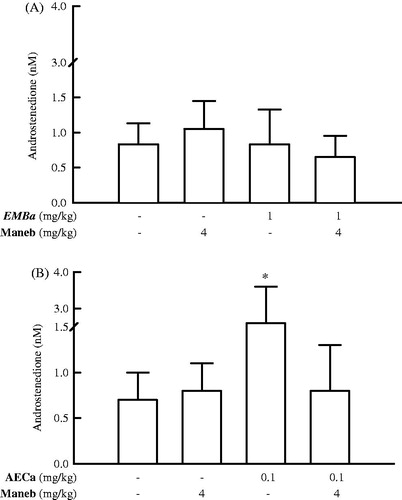
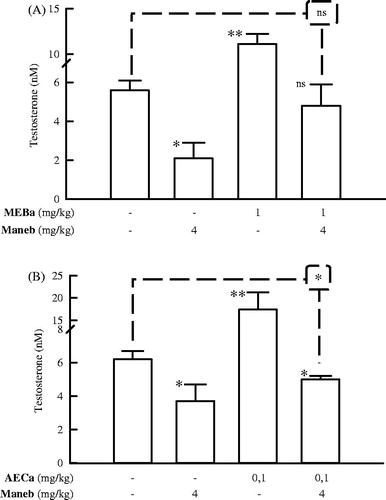
Figure 6. Serum testosterone levels of male rats treated with MEBa (A)/AECa (B) and/or maneb. The first batch of male rats was administered MEBa and/or 2% SS for 30 days (A), while the second batch received AECa and/or distilled water for 60 days (B). Maneb and 0.9% NaCl were administered during the 18 last days of the experiment. Data represent mean ± SD of five animals. ns: nonsignificant; *p < 0.05 and **p < 0.02, compared with the corresponding control group (group receiving neither plant extract nor maneb) (Student–Newman–Keuls test).