Figures & data
Figure 1. Effects of co-administration of HC1 (360 mg/kg, p.o.) and veratrine (0.06 mg/kg i.p.) on immobility time in the forced swimming test (A) and number of crossings in open-field test (B) in mice. Results expressed as mean ± SEM. *p < 0.05 compared to control groups (one-way ANOVA followed by Dunnett’s test).
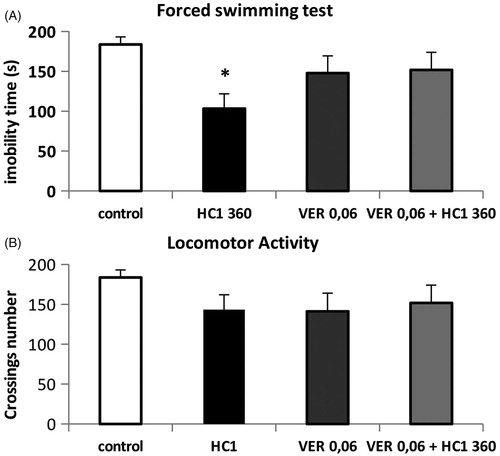
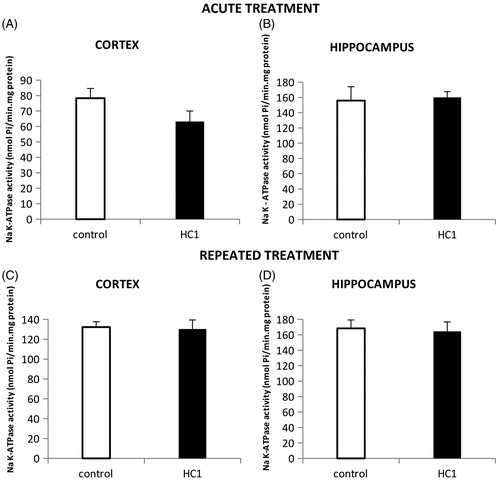
Figure 2. Effects of HC1 (360 mg/kg, p.o.) acute treatment (a single administration) on Na+, K+ ATPase activity in the cerebral cortex (A) and in the hippocampus (B) of mice. Panels C and D shows the effects of HC1 (360 mg/kg, p.o.) repeated treatment on Na+, K+ ATPase activity in the cerebral cortex and in the hippocampus of mice. Results expressed as mean ± SEM (t-test). **p < 0.01 and ***p < 0.001 compared to control groups.
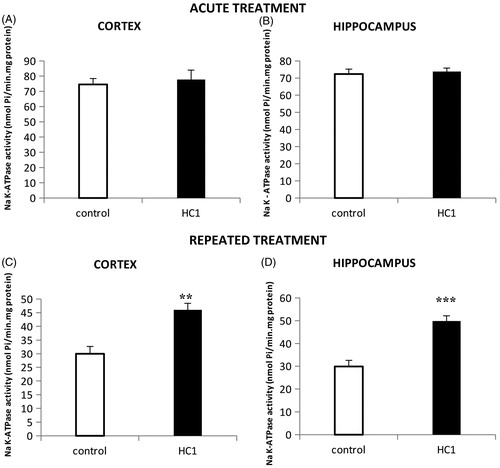
Figure 3. Effects of HC1 (360 mg/kg, p.o.) acute treatment (a single administration) on Na+, K+ ATPase activity in the cerebral cortex (A) and in the hippocampus (B) of mice submitted to swimming session. Panels C and D shows the effects of HC1 (360 mg/kg, p.o.) repeated treatment on Na+, K+ ATPase activity in the cerebral cortex and in the hippocampus of mice submitted to swimming session. Results expressed as mean ± SEM (t-test).