Figures & data
Figure 1. The chemical structure of HBC. It has a molecular formula C28H24N2O6 with a molecular weight of 484.16 g/mol.
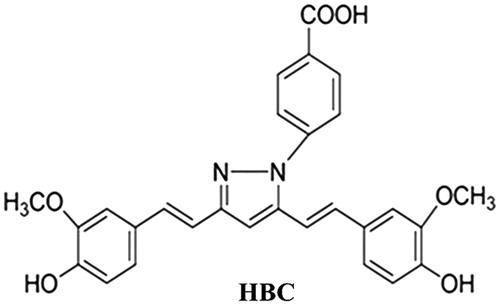
Figure 2. (A) Alteration of cellular morphology upon HBC treatment. Images showed HBC-treated A549 cells at different concentrations and time points. (B) Effects of HBC on viability of A549 cells. A549 cells were followed exposure to various concentrations of HBC at different periods and cell viability was analyzed with the MTT assay. Values were given as mean ± SE; **p ≤ 0.05 (n = 6).
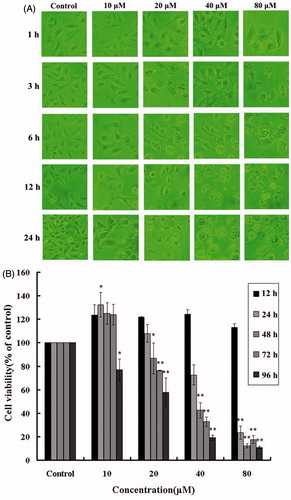
Figure 3. Microscopic detection of AVOs in HBC-A549 cells. Cells were incubated with various concentrations of HBC for different times and stained with acridine-orange. (A) Images were taken with a fluorescence microscope. (B) The percentage of AVO formation was plotted at the different concentrations of HBC. HBC-treaded cells were counted for 100 cells, and more than three areas were selected at random. Data are the means of triplicate experiments; error bars, SE (*p ≤ 0.05, ** p ≤ 0.01).
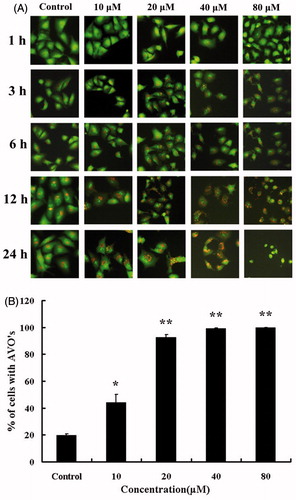
Figure 4. (A–J) Determination of autophagosomes punctuates by MDC. The fluorescence images of MDC fluorescence were taken by fluorescence microscopy. (K). The effect of wortmannin on HBC-treated A549 cells viability was determined. Data are presented as means, bars ± SE (n = 3), *p ≤ 0.05, **p ≤ 0.01.
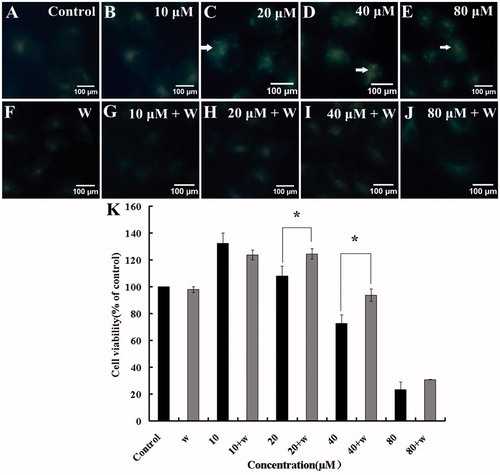
Figure 5. HBC increased formation of autophagosomes and fusion with lysosomes. A549 cells expressing GFP-LC3 were treated with HBC and the accumulation of LC3 II (green), localization of LC3 II with lysosomes (red) staining in response to treatment were analyzed by fluorescence microscopy (Scale bars = 100 μm). (A), (B) and (C) were bright images. (D) A549 cells were transfected with GFP. (E) A549 cells were transfected with GFP-LC3 and treated with DMSO. (F) A549 cells were transfected with GFP-LC3 and treated with HBC. (G–I) A549 cells were stained with LysoTracker Red. (J–L) Green and red images were merged. (M) The percentage of GFP-LC3 dot formation cells was counted in the total GFP expressing cells (n ≥ 3, **p ≤ 0.01).
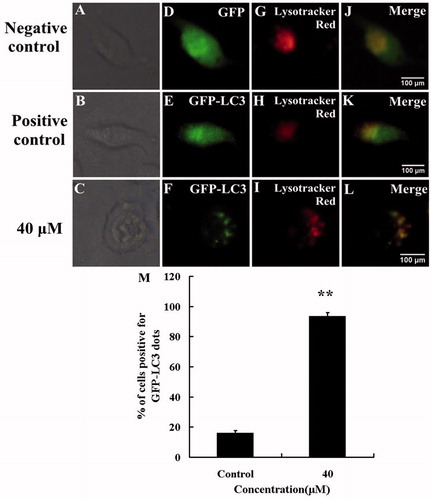
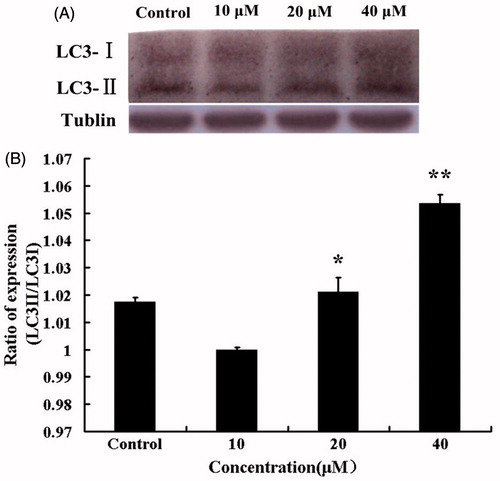
Figure 6. (A) Western blotting was performed with A549 cells after treatment with HBC (0–40 μM) for 24 h. Tubulin was used as internal control. (B) The ratio of LC3-II to tubulin was calculated to present the autophagic level (n = 3 and *p ≤ 0.05, **p ≤ 0.01).