Figures & data
Table 1. Effects of IBP and/or ZE treatments on body weight in rats.
Table 2. Effects of IBP and/or ZE treatments on some serum biochemical parameters in rats.
Table 3. Effects of IBP and/or ZE treatments on some antioxidant enzymes in rats.
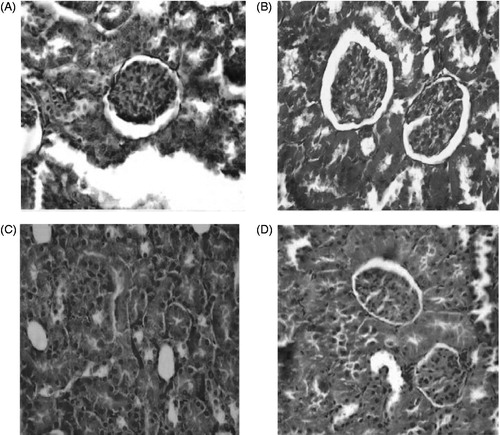
Figure 1. Micrographs of rat kidney tissues: (A) Saline group, normal morphology; (B) ZE group, similar structure as saline group with normal tubules and glomeruli; (C) IBP-treated group, hypercellularity in some and shrinkage in other glomeruli lines, ischemia in proximal convoluted tubules and congestion and (D) ZE + IBP-treated group, normal morphology of tubules and glomeruli as saline group.