Figures & data
Table 1. Phytochemical components of the crude methanol extract of E. camadulensis.
Figure 1. Effects of ME on EAC cell growth inhibition. Results are shown as mean ± SEM (standard error of mean), where significant values are *p < 0.05, **p < 0.01 and ***p < 0.001 when (EAC + ME) treated mice compared with EAC bearing control mice (EAC bearing only).
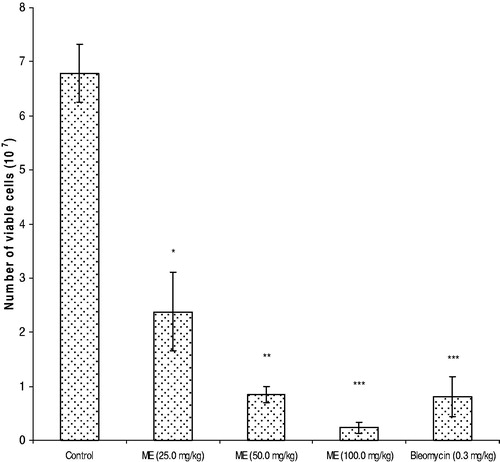
Figure 2. Effects of ME on survival time of tumor bearing mice. Results are shown as mean ± SEM (standard error of mean), where significant values are *p < 0.05, **p < 0.01 and ***p < 0.001 when (EAC + ME) treated mice compared with EAC bearing control mice (EAC bearing only).
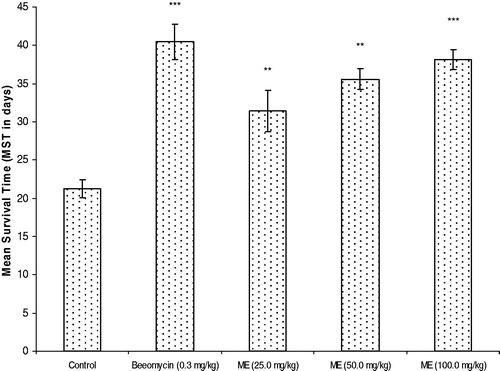
Figure 3. Tumor weight of EAC bearing mice treated with ME and bleomycin. Results are shown as mean ± SEM (standard error of mean), where significant values are *p < 0.05, **p < 0.01 and ***p < 0.001 when (EAC + ME) treated mice compared with EAC bearing control mice (EAC bearing only).
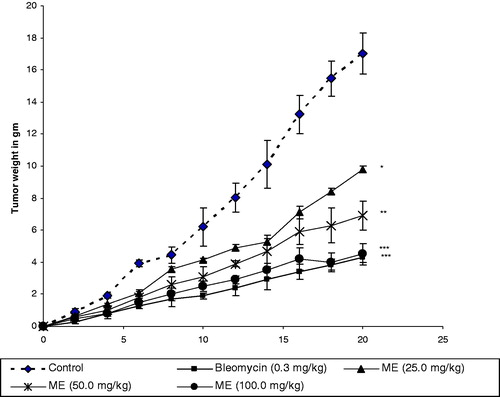
Table 2. Effects of ME on hematological parameters in experimental mice.
Table 3. Effect of ME on biochemical parameters in experimental mice.
Figure 4. Effects of ME on the enhancement of macrophages and peritoneal cells. Results are shown as mean ± SEM (standard error of mean), where significant values are *p < 0.05, **p < 0.01 and ***p < 0.001 when (EAC + ME) treated mice compared with EAC bearing control mice (EAC bearing only).
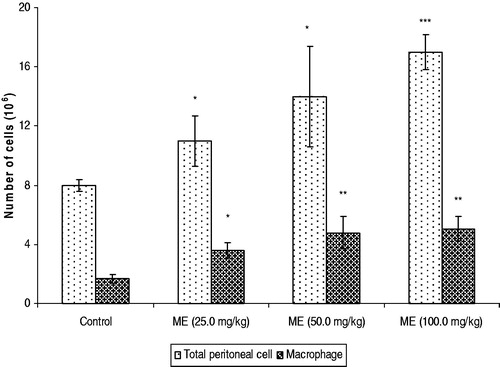
Figure 5. Fluorescence microscopic view of control and treated EAC cells. (A) EAC of normal mice shown no apoptotic features. (B) EAC cells treated with extract shown nuclear condensation, fragmentation, cell membrane blebbing, apoptotic bodies, etc, (indicated by arrows). (C) Cells undergone late apoptosis shown in PI staining. EAC cells were collected from control and treated mice on day 6. After washing with PBS all cells were stained with 0.1 µg/ml of Hoechst 33342 at 37 °C for 20 min. Then the cells were washed with phosphate buffer saline (PBS) and re-suspended in PBS for observation of morphological changes under fluorescence microscopy (Olympus IX71, Korea). Cells also stained with propidium iodide (PI) to observe necrotic or late apoptotic death.
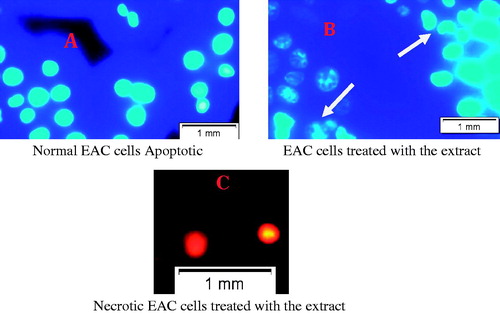
Figure 6. Effect of caspase inhibitors on EAC cell. Results are shown as mean ± SEM (standard error of mean), where significant value **p < 0.01 when (EAC + ME + Z-IETD-FMK) treated mice compared with EAC bearing control mice (EAC bearing only).
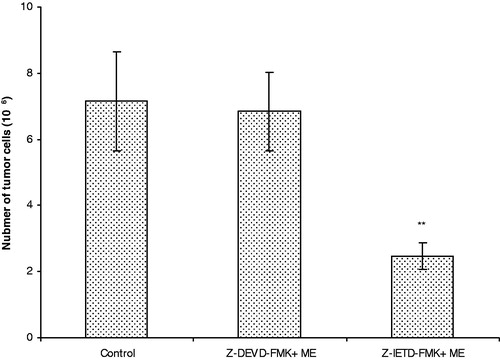
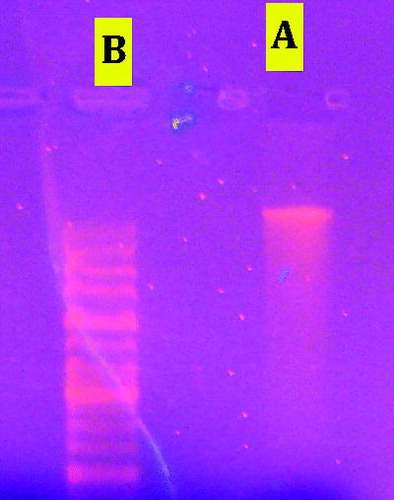
Figure 7. In vivo effects of extract on DNA fragmentation of EAC cells. DNA run and detected on 1.5% agarose gel electrophoresis. (A) DNA from control EAC cells, (B) DNA from Eucalyptus treated EAC cells (DNA fragmentation detected from treated EAC cells).