
Figures & data
Figure 1. Chemical structures of baicalein (B), wogonin (W), oroxylin A (OA), mefenamic acid (MEF) and 3,7-dihydroxyflavone (IS).
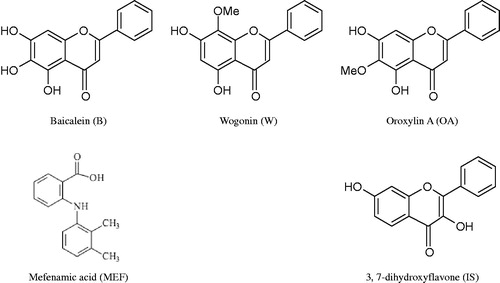
Figure 2. Representative mass spectra of glucuronic acid and sulfate conjugates of B/W/OA in Caco-2 samples from apical to basolateral transport study. BG (445/269): Baicalein-7-O-glucuronide; BS (349/269): Baicalein-O-sulfate; WG (459/283): Wogonin-7-O-glucuronide; WS (363/283): Wogonin-O-sulfate; OAG (459/283): Oroxylin A-7-O-glucuronide; OAS (363/283): Oroxylin A-O-sulfate.
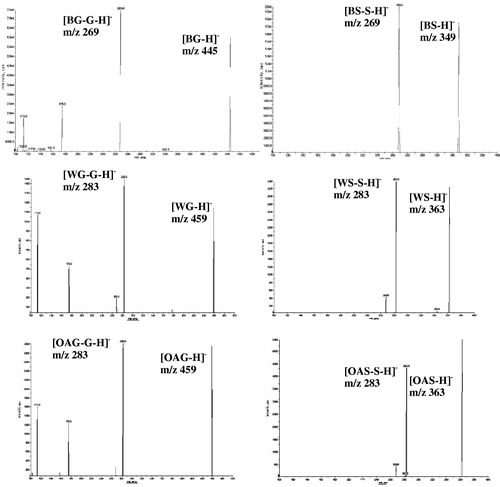
Figure 3. Cumulative amount of B, W and OA at the receiver side as a function of time during absorption transport in Caco-2 cell monolayer model.
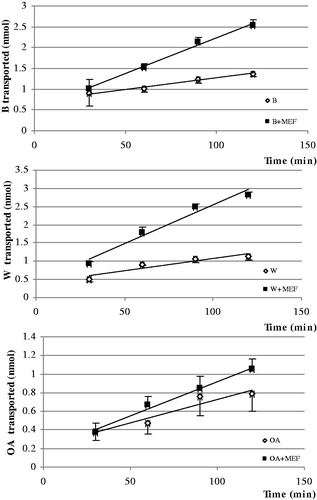
Table 1. Effect of MEF on the absorption (Papp) and metabolism (% of metabolism) of B/W/OA (10 μM) in the Caco-2 monolayer model (n = 3).
Figure 4. Efflux transport of glucuronides and sulfates of B, W and OA at the apical and basolateral sides during absorption in the Caco-2 cell monolayer model.
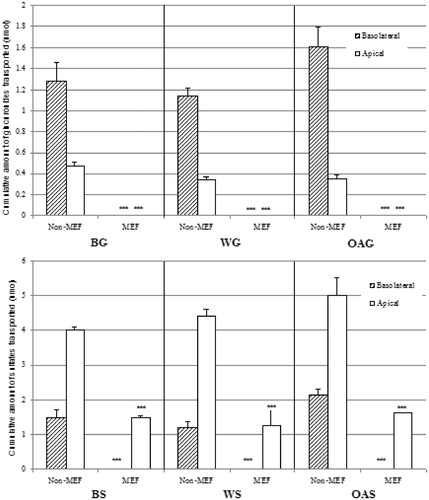
Table 2. Effect of RS, MEF and co-administration on the production of PGE2 in rat (n = 3).