Figures & data
Figure 1. (a) Q1 and product ion scan data of AG in LC-MS/MS and (b) Q1 and product ion scan data of diclofenac in LC-MS/MS.
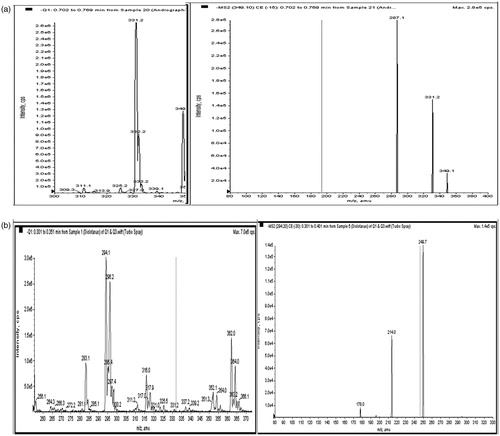
Table 1. MS parameters of AG and diclofenac.
Figure 2. (a) Representative chromatogram of blank plasma, (b) representative chromatogram of blank kidney and (c) representative chromatogram of unknown plasma sample with analyte and IS.
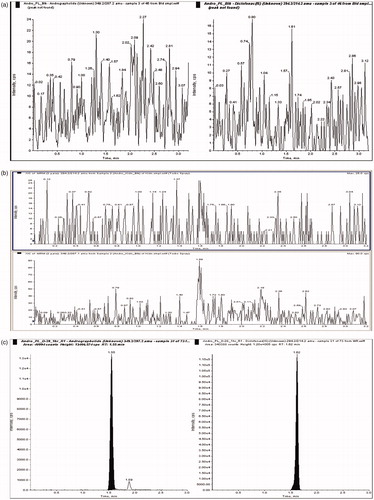
Table 2. Intra-day and inter-day accuracy and precision of AG.
Table 3. Stability study data of AG.
Table 4. Extraction recovery and ME of AG.
Figure 3. Mean (±SD) plasma exposure profile of AG after oral administration at 30 mg/kg in rats.
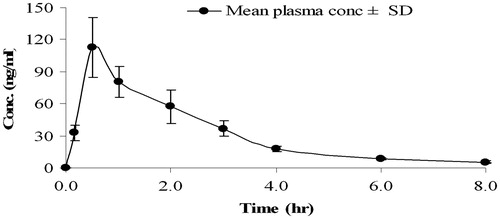
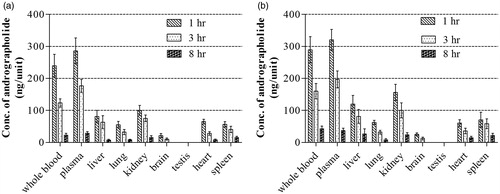
Figure 4. (a) Concentration of AG in whole blood, plasma and different tissues after multiple oral administration of AG and (b) concentration of AG in whole blood, plasma and different tissues after multiple oral administration of APE.