Figures & data
Figure 1. HPLC chromatograms of dialysate of n-butanol extract of P. cuspidatum (PCB): (1) “blank dialysate” of PCB; (2) “interaction dialysate” of PCB and (3) blank control.
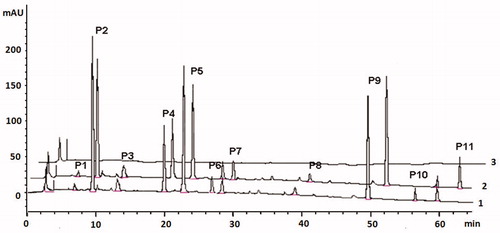
Table 1. Binding degrees of two permeable components in PCB.
Figure 2. Chemical structures of polydatin (C1) and emodin-8-O-β-d-glucoside (C2).
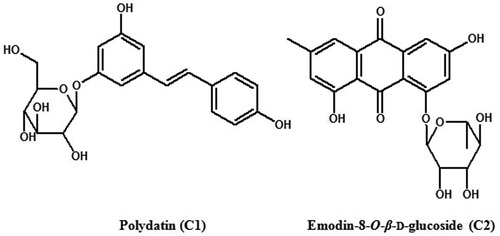
Figure 3. Effects of polydatin (C1) and emodin-8-O-β-d-glucoside (C2) on cell viability of SH-SY5Y cells. Compared with the control group, *p < 0.05 and **p < 0.01.
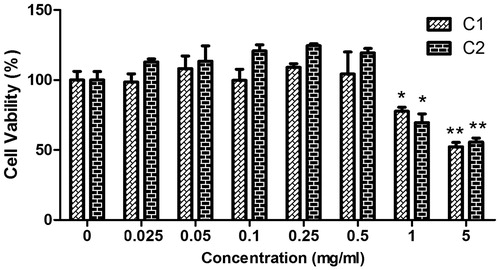
Figure 4. Effects of polydatin (C1) and emodin-8-O-β-d-glucoside (C2) on protein expression of α7 nAChR, α3 nAChR and SPY in SH-SY5Y cells. Protein expression of α3 nAChR in SH-SY5Y cells treated with 0.1 and 0.25 mg/mL C1 (A) or C2 (B); protein expression of α7 nAChR in SH-SY5Y cells treated with 0.1 and 0.25 mg/mL C1 (C) or C2 (D); protein expression of SPY in SH-SY5Y cells treated with 0.1 mg/mL C2 (E); compared with the control group, *p < 0.05 and **p < 0.01. The image shown is representative of three independent experiments.
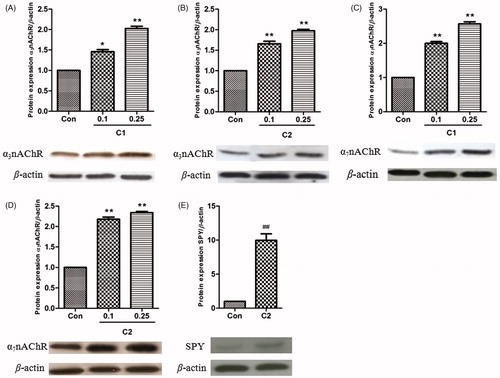
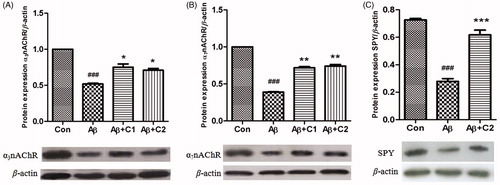
Figure 5. Effects of polydatin (C1) and emodin-8-O-β-d-glucoside (C2) on protein expression of α7 nAChR, α3 nAChR and SPY in Aβ1-42-induced SH-SY5Y cells. Protein expression of α3 nAChR in Aβ1–42-induced SH-SY5Y cells treated with 0.1 mg/mL C1 or C2 (A); protein expression of α7 nAChR in Aβ1-42-induced SH-SY5Y cells treated with 0.1 mg/mL C1 or C2 (B); protein expression of SPY in Aβ1–42-induced SH-SY5Y cells treated with 0.1 mg/mL C2 (C); compared with the control group, ###p < 0.001; compared with Aβ1–42-treated model group, *p < 0.05, **p < 0.01 and ***p < 0.001. The image shown is representative of three independent experiments.