Figures & data
Figure 1. Inhibitory effect of AME extract on AAPH (20 mM) induced pBR322 DNA damage. Lane 1, plasmid only (negative control); Lane 2, plasmid + AAPH (positive control); Lane 3–5, plasmid DNA + AAPH + extract (25, 50 and 100 µg); Lane 6, chlorogenic acid (5 µg).
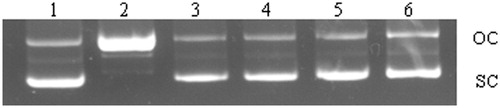
Figure 2. Inhibitory effect of AME extract on AAPH (20 mM) induced oxidative fragmentation of BSA. Lane 1, BSA only; Lane 2, BSA + AAPH (positive control); Lane 3–7, BSA + AAPH + extract (100, 80, 60, 40 and 20 µg); Lane 8, chlorogenic acid (5 µg).
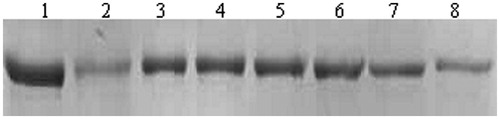
Figure 3. Inhibitory effect of AME extract on AAPH (20 mM) induced lipid peroxidation.
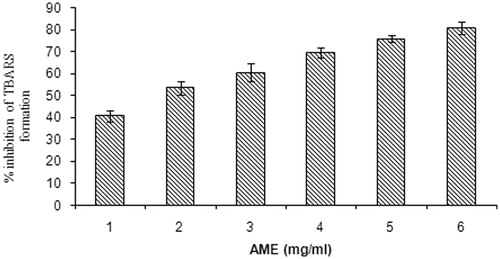
Figure 4. HPLC chromatogram of AME extract. Retention time in min (RT): gallic acid 9.0, chlorogenic acid 20.4, tannic acid 25, ferulic acid 30.6 and quercetin 44.7.
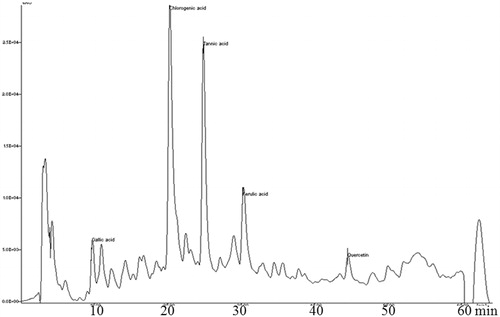
Figure 5. Effect of AME on body weight of mice. 1: sedentary control, 2: exercise control, 3:100 mg AME/kg b.wt, 4: 200 mg AME/kg b.wt and 5: 400 mg AME/kg b.wt AME.
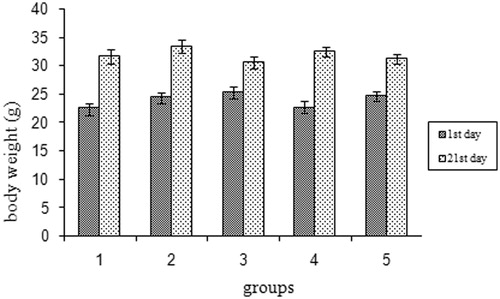
Figure 6. Effect of AME on swimming duration to exhaustion of mice. As compared with exercise control: ap < 0.05, bp < 0.01.
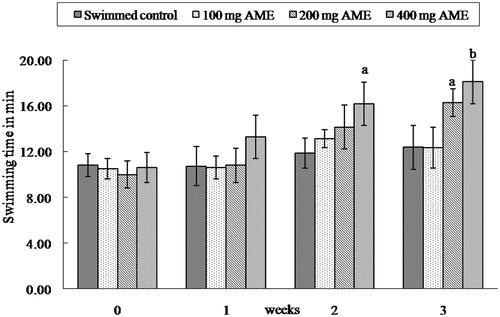
Table 1. Effect of AME on the blood parameters.
Figure 7. Effect of AME on glycogen content. 1: sedentary control, 2: exercise control, 3: 100 mg AME/kg b.wt, 4: 200 mg AME/kg b.wt and 5: 400 mg AME/kg b.wt AME. As compared with sedentary control: ap < 0.01. As compared with exercise control: bp < 0.05, cp < 0.01.
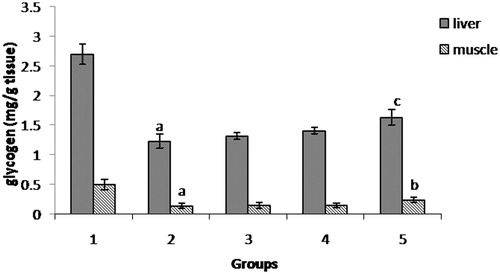
Figure 8. Effect of AME hepatic lipid peroxidation. 1: sedentary control, 2: exercise control, 3: 100 mg AME/kg b.wt, 4: 200 mg AME/kg b.wt and 5: 400 mg AME/kg b.wt. As compared with sedentary control: ap < 0.01. As compared with exercise control: bp < 0.05, cp < 0.01.
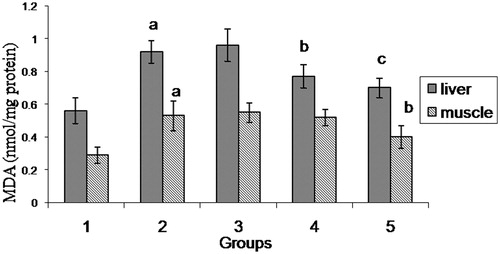
Table 2. Effect of AME on the hepatic antioxidant enzymes.
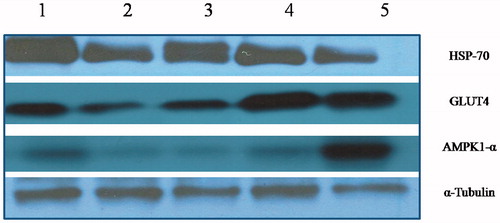
Figure 9. Western blots analysis of Hsp-70 and skeletal muscle metabolic regulators in muscle tissues of mice. 1: exercise control, 2: sedentary control, 3: 100 mg AME/kg b.wt, 4: 200 mg AME/kg b.wt and 5: 400 mg AME/kg b.wt AME.