Figures & data
Table 1. Effects of XFSWD on the level of writhing scores, Ca2+, and nitric oxide (NO).
Figure 1. Representative UHPLC-Q-TOF-MS base peak intensity (BPI) chromatogram of a rat plasma sample analyzed in negative and positive ion modes.
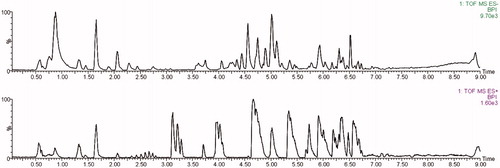
Table 2. The variations of retention times and m/z values and the relative standard deviations of peaks areas from reference compound peaks in positive and negative ESI modes (n = 12).
Figure 2. PCA-DA scores plots. (a) Negative ion mode, (b) positive ion mode, (▪) normal group without treatment, and (▴) dysmenorrhea syndrome model group without treatment.
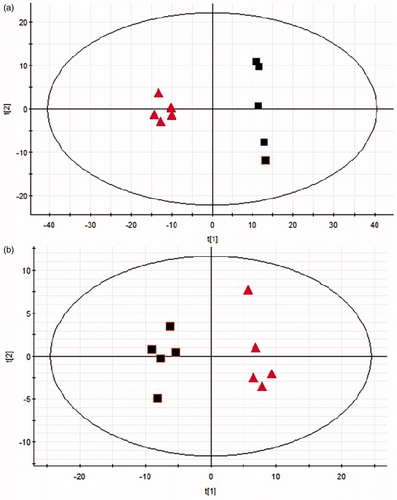
Figure 3. PLS-DA scores plots. (a) Negative ion mode, (b) positive ion mode, (▪) normal group without treatment, and (▴) dysmenorrhea syndrome model group without treatment.
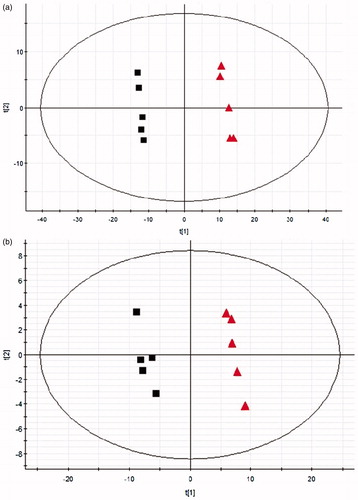
Figure 4. OPLS-DA S-plot. (a) Negative ion mode and (b) positive ion mode.
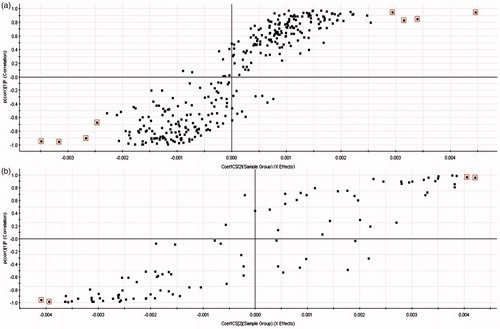
Table 3. Potential markers from rats with dysmenorrhea syndrome (p < 0.05) and their identification results on ESI+ and ESI− scans.
Figure 5. Identification of a selected marker. (A) Peak of potential biomarker of m/z 315 in extracted ion chromatogram with negative mode. (B) Corresponding mass spectrum. (C) MSE spectrum, the collision energy was 25 eV.
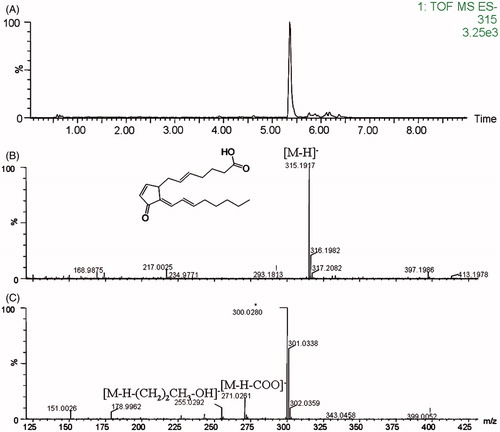
Figure 6. Mean peak area (mean±standard error) of markers (a–l) from normal and dysmenorrhea syndrome rats plasma samples after administration of XFSWD at 30 min, 2 h, 6 h, and 12 h (n = 5). (▪) Dysmenorrhea syndrome model group with treatment and (□) normal group with treatment.
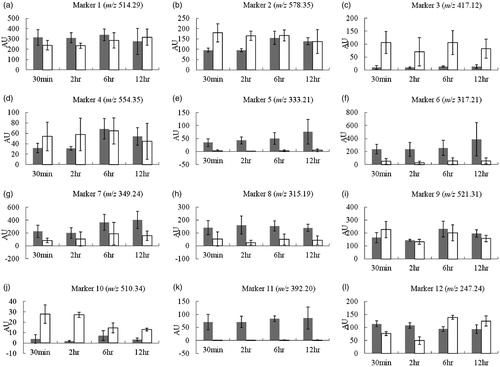
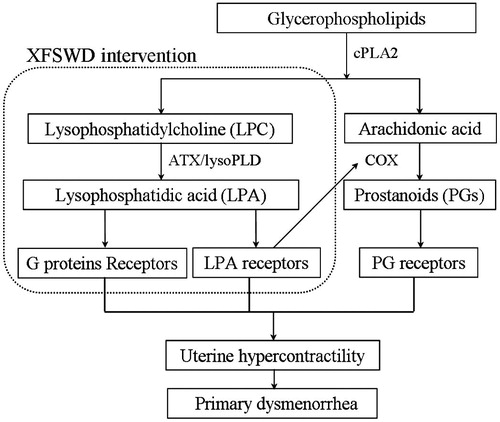
Figure 7. Scheme illustrating sphingolipid metabolism and Xiang–Fu–Si–Wu Decoction intervention.