Figures & data
Figure 1. HPLC elution pattern of honokiol and magnolol from an ethanol extract of Magnolia dealbata seeds (MDE).
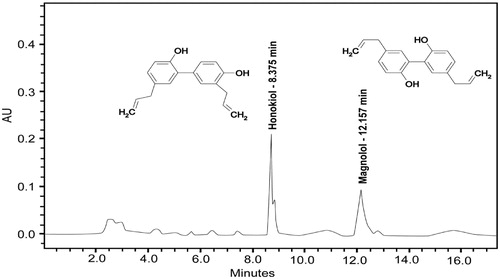
Table 1. Cytotoxic activity of MDE on human cancer and non-tumorigenic cells.
Figure 2. Effect of MDE on cell growth. MDA-MB231 (A) and HaCaT (B). After 2 days, cultures were fed with DMEM supplemented with 7% FBS added with different MDE concentrations. At the indicated days, the cell number was determined by direct cell counting in a hemacytometer. Figure represents the mean value of three independent experiments in triplicate ± standard deviation (SD).
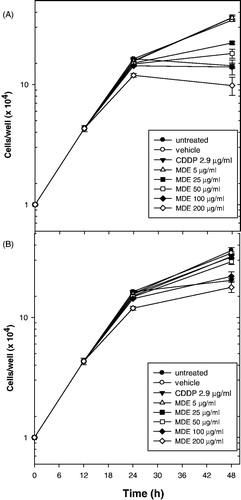
Figure 3. Determination of DNA fragmentation in MDA-MB231 cells treated with MDE by the TUNEL assay. Cells incubated with DMSO 0.01% for 24 h (A) and 48 h (D), cisplatin (CDDP) 2.9 μg/ml, as the positive control of apoptosis, for 24 h (B) and 48 h (E) or MDE 25 μg/ml for 24 h (C) and 48 h (F). Cells were subjected to the TUNEL assay. All photographs are shown at 20 × magnification. Results represent three independent experiments in duplicate.
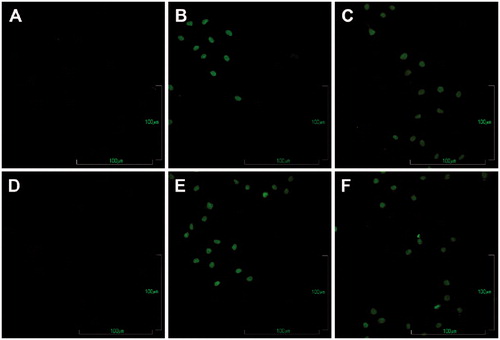
Figure 4. MDE induces the activation of caspase 3 in MDA-MB231 cells. Detection of caspase 3 using immunofluorescence analysis. MDA-MB231 cells grown on coverslips were treated with MDE 25 μg/ml. After 24 h or 48 h of treatment, cells were treated as described in Materials and methods and incubated with caspase 3 antibody. All photographs are shown at 40 × magnification. Data are representative of three independent experiments in duplicate.
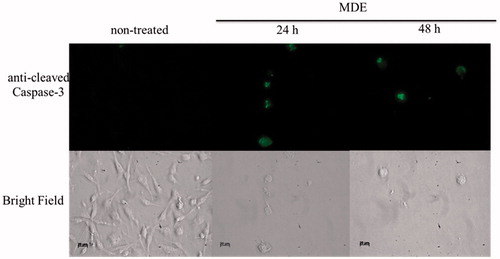
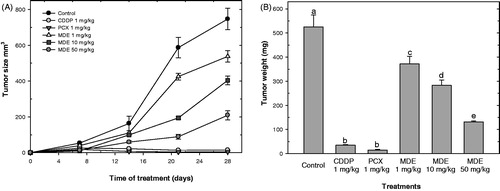
Figure 5. MDE induces chemopreventive effects in nu/nu mice bearing MDA-MB231 tumor. Mice were injected with MDA-MB231 cells (5 × 10⁶) and 4 h after tumor implantation, mice were treated with doses of MDE between 1 and 50 mg/kg, CDDP 1 mg/kg or PCX 1 mg/kg daily over a period of 28 days. At the end of the experiment, tumors were measured (A) and weighed (B) as described in the section “Materials and methods”. Data are representative of three independent experiments in quintuplicate. Results represent the mean ± standard deviation (SD). Lower case letters indicate significant differences according to ANOVA test (p ≤ 0.05), followed by the post hoc Tukey test.