1,137
Views
9
CrossRef citations to date
0
Altmetric
Research Article

Effects of Alismatis rhizome on rat cytochrome P450 enzymes

, , &
Pages 681-687 | Received 17 Sep 2013, Accepted 06 Nov 2013, Published online: 07 Feb 2014

Figures & data

Figure 1. Mean plasma concentration–time curves of phenacetin in rats.

Figure 1. Mean plasma concentration–time curves of phenacetin in rats.

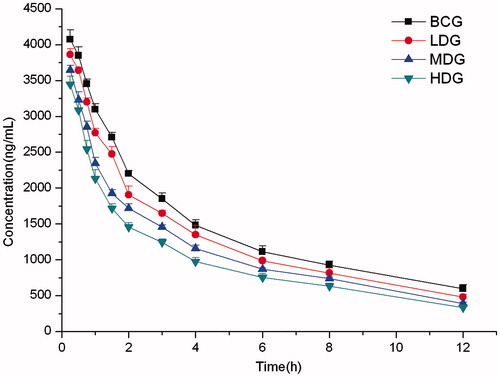
Table 1. Main pharmacokinetic parameters of phenacetin after multiple doses of RA in rat plasma (n = 6, mean ± SD).

Figure 2. Mean plasma concentration–time curves of tolbutamide in rats.

Figure 2. Mean plasma concentration–time curves of tolbutamide in rats.

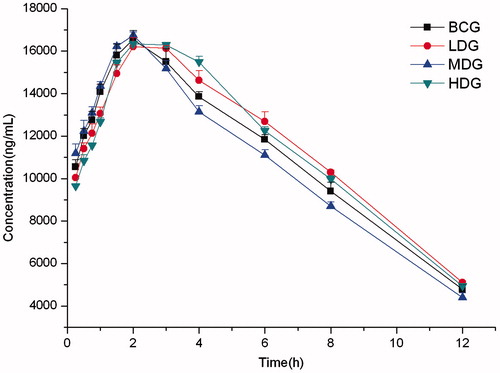
Table 2. Main pharmacokinetic parameters of tolbutamide after multiple doses of RA in rat plasma (n = 6, mean ± SD).

Figure 3. Mean plasma concentration–time curves of chlorzoxazone in rats.

Figure 3. Mean plasma concentration–time curves of chlorzoxazone in rats.

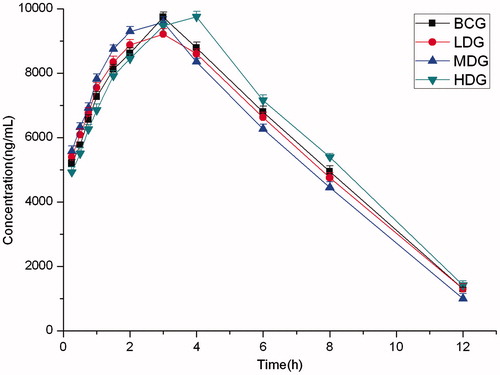
Table 3. Main pharmacokinetic parameters of chlorzoxazone after multiple doses of RA in rat plasma (n = 6, mean ± SD).

Figure 4. Mean plasma concentration–time curves of midazolam in rats.

Figure 4. Mean plasma concentration–time curves of midazolam in rats.

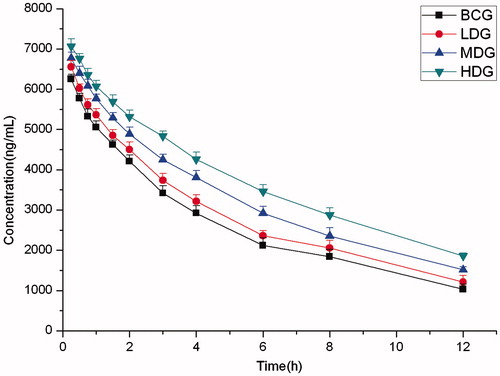
Table 4. Main pharmacokinetic parameters of midazolam after multiple doses of RA in rat plasma (n = 6, mean ± SD).

Reprints and Corporate Permissions

Please note: Selecting permissions does not provide access to the full text of the article, please see our help page How do I view content?

To request a reprint or corporate permissions for this article, please click on the relevant link below:

Academic Permissions

Please note: Selecting permissions does not provide access to the full text of the article, please see our help page How do I view content?

Obtain permissions instantly via Rightslink by clicking on the button below:

If you are unable to obtain permissions via Rightslink, please complete and submit this Permissions form. For more information, please visit our Permissions help page.