
Figures & data
Table 1. Assigned mouse groups.
Table 2. Amino acid composition of samples (mmol/mL).
Table 3. Total sugar content of samples (mg/mL).
Table 4. Effects on mouse body weight.
Figure 1. Effects on swimming endurance time of mice. Values were expressed as means ± SD of mice per group. Values with different superscripts indicate a significant difference among groups based on Duncan’s multiple range test (p < 0.05, n = 10).
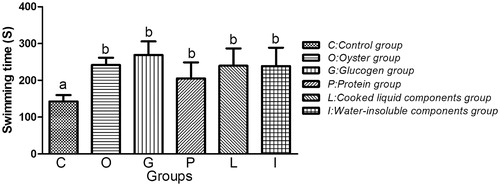
Table 5. Effect on the contents of serum lactic acid of mice.
Table 6. Effect on the contents of serum BUN of mice.
Table 7. Effect on the contents of liver and gastrocnemius muscle glycogen of mice.