Figures & data
Figure 1. Effect of curcumin alone (1 µM) or in combination with tempol (1 mM) or 1400 W (1 µM) on fructose-treated isolated rat aorta responsiveness to KCl. Symbols indicate mean ± SEM for n = 6–10 aortic rings; ***p < 0.001, compared with the corresponding control group values; ###p < 0.001 compared with the corresponding fructose group values; aap < 0.001 compared with curcumin group values.
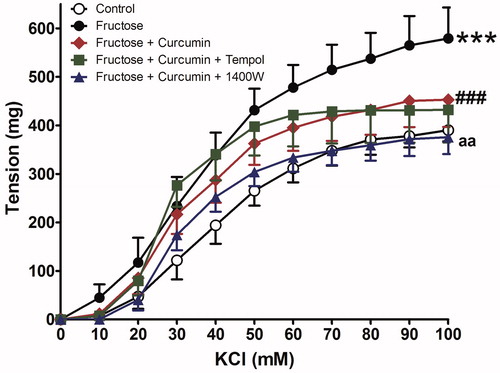
Figure 2. Effect of curcumin alone (1 µM) or in combination with tempol (1 mM) or 1400 W (1 µM) on fructose-treated isolated rat aorta responsiveness to phenylephrine (PE). Symbols indicate mean ± SEM for n = 6–10 aortic rings; ***p < 0.001, compared with the corresponding control group values; ##p < 0.001 compared with the corresponding fructose group values; ap < 0.01 compared with curcumin group values.
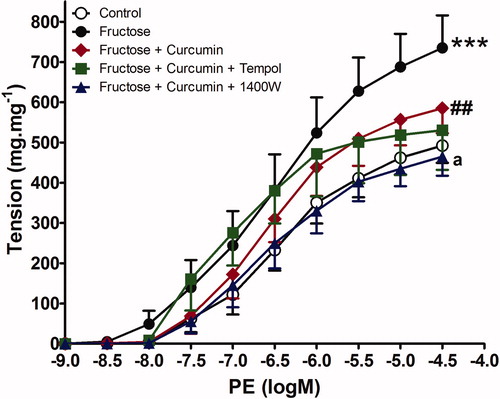
Table 1. Effect of fructose and curcumin either alone or in combination with either tempol or 1400 W on the maximal response (Emax) and pD2 (−Log EC50) values of phenylephrine (PE), potassium chloride (KCl), and acetyl choline (Ach), dose–response curves.
Figure 3. Effect of curcumin alone (1 µM) or in combination with tempol (1 mM) or 1400 W (1 µM) on fructose-treated isolated rat aorta responsiveness to acetylcholine (Ach). Symbols indicate mean ± SEM for n = 6–10 aortic rings.
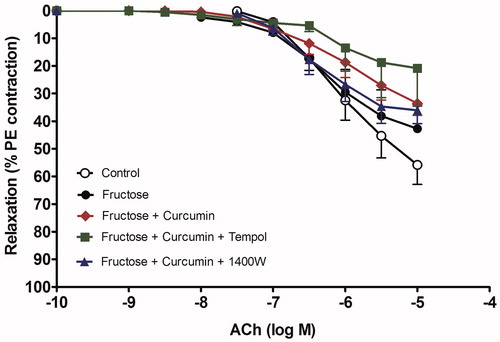
Figure 4. Effect of curcumin (1 µM) on intracellular calcium in fructose-treated isolated rat aorta. Symbols indicate mean ± SEM for n = 6–10 aortic rings; *p < 0.05, compared with the corresponding control group values; **p < 0.05 compared with the corresponding fructose group values.
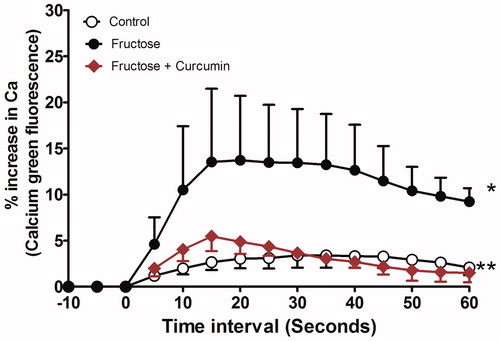
Figure 5. Effect of curcumin (1 µM) on area under the calcium curve (AUC) intracellular calcium in fructose-treated isolated rat aorta. Symbols indicate mean ± SEM for n = 6–10 aortic rings; *p < 0.05, compared with the corresponding control group values; **p < 0.05 compared with the corresponding fructose group values.
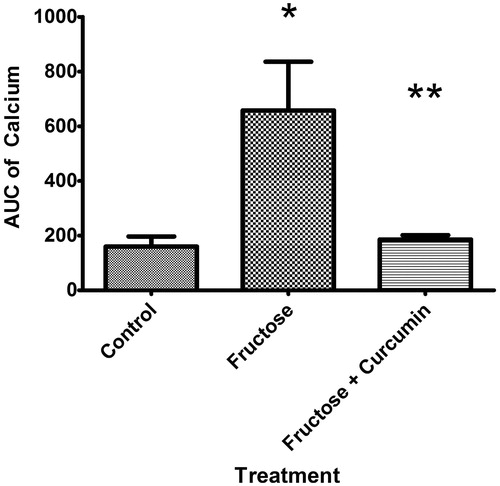
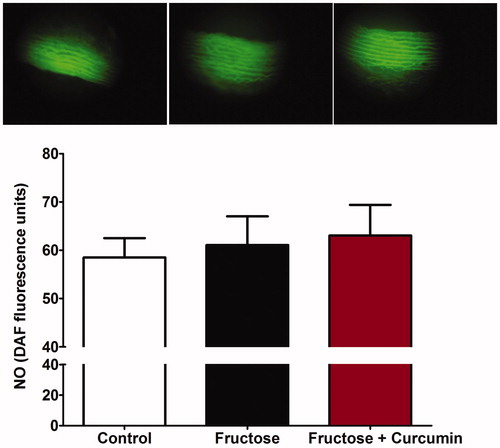
Figure 6. Effect of curcumin (1 µM) on intracellular nitric oxide (NO) in fructose-treated isolated rat aorta. Symbols indicate mean ± SEM for n = 6–10 aortic rings.