Figures & data
Figure 1. (a) HPTLC profile of CALE under UV 366 nm. (b) HPTLC chromatogram of CALE at a scan wavelength of 278 nm. T1: standard ellagic acid; T2: standard gallic acid; T3: standard quercetin.
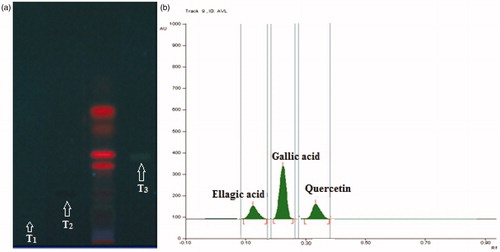
Figure 2. Effect of CALE on H+K+ATPase activity in gastric mucosa and gastric wall mucus in EtOH-induced ulcer group. +p < 0.001 compared to the respective normal control group. ap < 0.05, bp < 0.01 and cp < 0.001 compared to the respective EtOH-induced ulcer group.
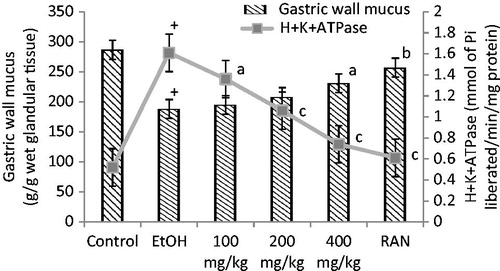
Table 1. Gastroprotective activity of CALE on aspirin-, EtOH-, CRS-, and PL-induced ulcers.
Table 2. Effect of CALE on gastric secretion in 4h PL rats: effect on volume, acid, and pepsin.
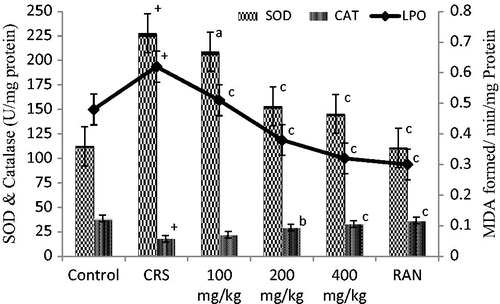
Figure 3. Effect of CALE on LPO, SOD and CAT activity in rat gastric mucosa in CRS-induced gastric ulcers in rats. +p < 0.001 compared to the respective control group. ap < 0.05, bp < 0.01 and cp < 0.001 compared to the respective CRS group.