Figures & data
Table 1. Effect of Butea monosperma bark on body weight, serum glucose, plasma insulin, and glycosylated hemoglobin in normal and diabetic rats.
Figure 1. Effect of Butea monosperma bark on lipid profile in normal and diabetic rats. The data are expressed as mean ± SD. ap < 0.05 compared to the normal control group; bp < 0.05 compared to the diabetic control group.
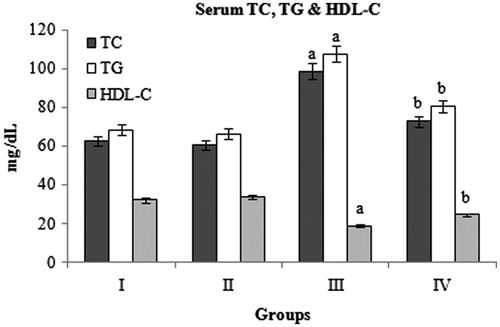
Figure 2. Effect of Butea monosperma bark on apolipoproteins in normal and diabetic rats. The data are expressed as mean ± SD. ap < 0.05 compared to the normal control group; bp < 0.05 compared to the diabetic control group.
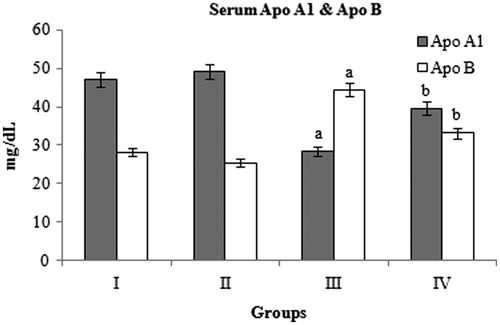
Figure 3. Effect of Butea monosperma bark on HMG CoA reductase in normal and diabetic rats. The data are expressed as mean ± SD. ap < 0.05 compared to the normal control group; bp < 0.05 compared to the diabetic control group.
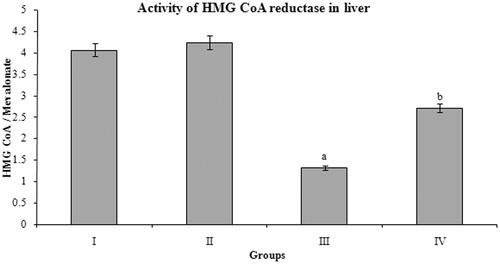
Figure 4. Effect of Butea monosperma bark on malic enzyme in normal and diabetic rats. The data are expressed as mean ±SD. ap < 0.05 compared to the normal control group; bp < 0.05 compared to the diabetic control group.
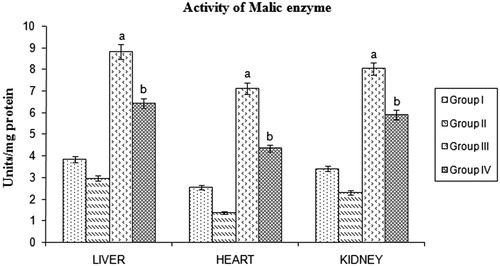
Figure 5. Effect of Butea monosperma bark on isocitrate dehydrogenase in normal and diabetic rats. The data are expressed as mean ± SD. ap < 0.05 compared to the normal control group; bp < 0.05 compared to the diabetic control group.
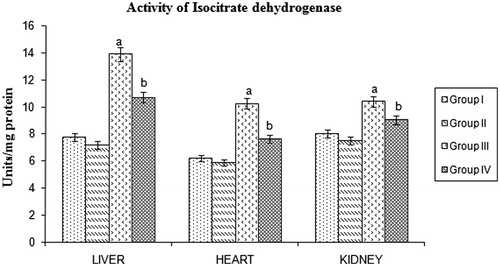
Figure 6. Effect of Butea monosperma bark on glucose 6-phosphate dehydrogenase in normal and diabetic rats. The data are expressed as mean ± SD. ap < 0.05 compared to the normal control group; bp < 0.05 compared to the diabetic control group.
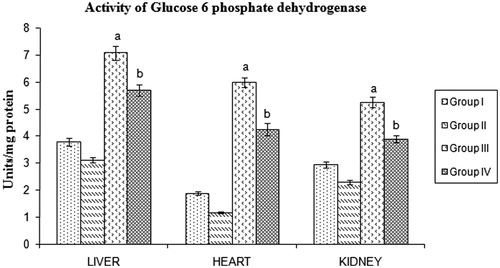
Table 2. Effect of Butea monosperma bark on liver function tests in normal and diabetic rats.
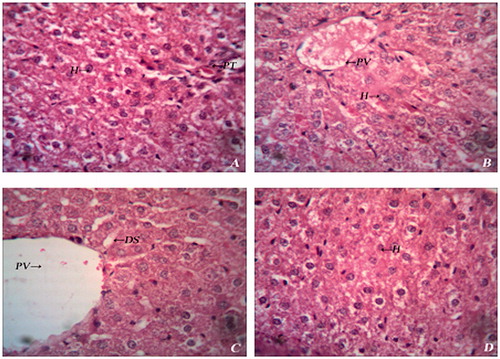
Figure 7. Histopathology of liver of experimental rats. (A) Group I – Normal histology showing hepatocytes (H) and portal triad (PT); (B) Group II – Normal histology showing hepatocytes (H) and portal vein (PV); (C) Group III – Diabetic liver showing dialated sinusoids (DS) and haemorrhage; (D) Group IV – Diabetic liver showing mild degeneration of hepatocytes (H).