Figures & data
Table 1. Effects of chronic variable stress and treatments on blood biochemical parameters.
Table 2. Effects of chronic variable stress and treatments on morphological parameters.
Figure 1. Effects of chronic variable stress and treatments on spatial reference memory acquisition. Data are expressed as mean ± S.E.M. These values represent the median latency (s) in finding the platform from four trials during five days of training. No significant differences were observed between groups (One-way ANOVA with the post-hoc Newman–Keuls test, p > 0.05), n = 7–6 animals/group.
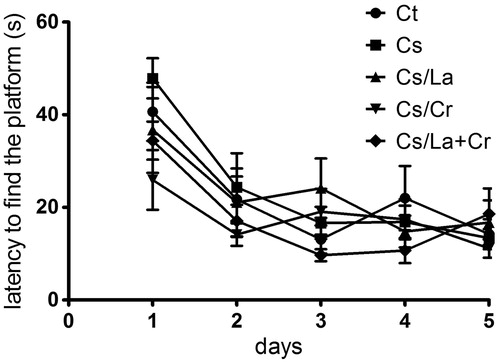
Figure 2. Effects of chronic variable stress and treatments on reference memory retention: (A) latency in finding the platform and (B) mean % time spent in the target quadrant (T.Q.). Data are expressed as mean ± S.E.M. *Significantly different from Ct, Cs, and Cs/La groups (One-way ANOVA with the post-hoc Newman–Keuls test, p < 0.05), n = 7–6 animals/group.
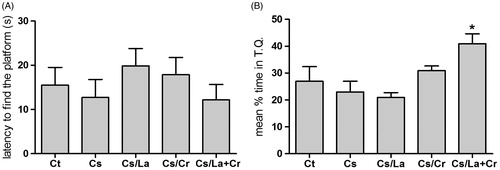
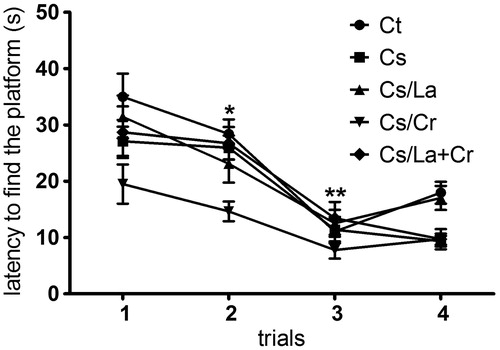
Figure 3. Effects of chronic variable stress and treatments on spatial working memory. Data are expressed as mean ± S.E.M. These values represent mean latencies in finding the platform in each trial during four testing days. Statistical difference between the Cs/Cr group and other groups in the second (*p < 0.05) and third trials (**p < 0.001) (repeated-measures ANOVA with the post-hoc Newman–Keuls test), n = 7–6 animals/group.