Figures & data
Figure 1. Chemical structure of oxysophocarpine (OSC). The molecular formula for OSC is C15H22N2O2 and the molecular weight is 262.35.
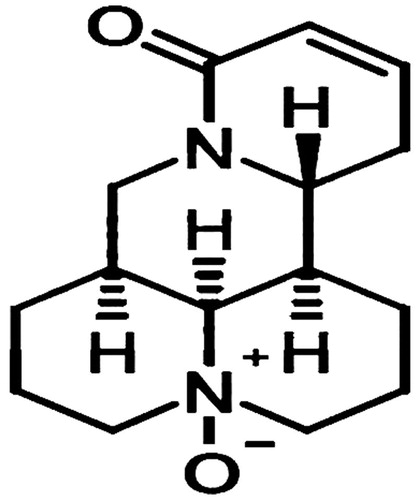
Figure 2. Hippocamoal neurons fluorescense staining with rabbit anti-rat neuron-specific enolase (NSE). The purity of hippocamoal neurons was calculated as over 87% (×200).
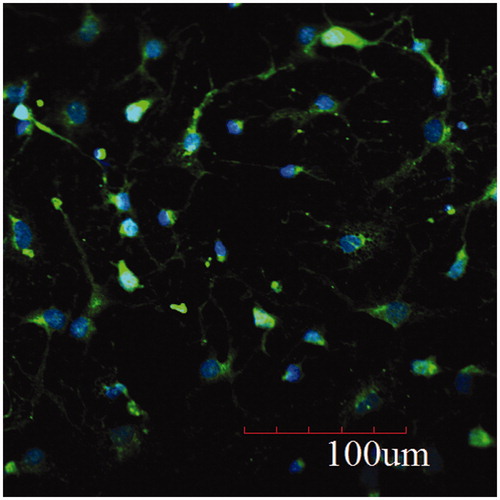
Figure 3. Effects of OSC on cell viability in primary hippocampal neuronal cell under oxygen–glucose deprivation for 2 h and reperfusion for 24 h, determined by the MTT assay (A), and the extent of LDH release (B). Histograms represent mean ± SD, n = 6. ###p < 0.001 OGD/RP + vehicle group versus control group; *p < 0.05, ***p < 0.001 versus OGD/RP + vehicle group.
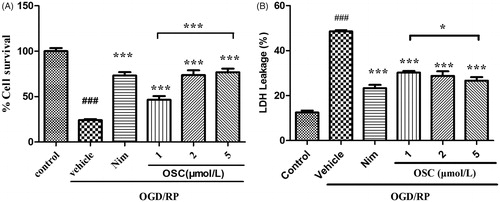
Figure 4. Effects of OSC on morphological changes of OGD/RP injured primary hippocampal neurons. Cellular morphological changes were examined using Olympus optics (Olympus, Tokyo, Japan) (A–F, ×400). Nuclei were labeled with Hoechst 33342 (G–L, ×400). Representative photomicrographs showing damage of neurites and denote chromatin condensation of hippocampal neurons. (A, G) Control; (B, H) exposure to OGD/RP; (C, I) treated with Nim (12 μmol/L); (D, J) treated with low concentration of OSC (1 μmol/L); (E, K) treated with a middle concentration of OSC (2 μmol/L); (F, L) treated with a high concentration of OSC (5 μmol/L).
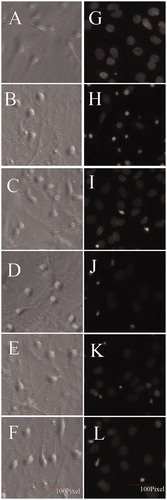
Figure 5. Effects of OSC on [Ca2+]i in primary hippocampal neuronal cell under OGD 2 h/RP 24 h as indicated by Fluo-3/AM(×100). (A) Control cells. (B) Cells exposed to OGD 2 h/RP 24 h with no treatment of OSC. (C) Nim (12 μmol/L) was added to the culture before the reperfusion. (D–F) OSC (1, 2, and 5 μmol/L) was, respectively, added to the culture before the reperfusion. (G) Effects of OSC on [Ca2+]i in primary hippocampal neuronal cell under OGD 2 h/RP 24 h. Histograms represent mean ± SD, n = 6. ###p < 0.001 OGD/RP + vehicle group versus control group; ***p < 0.001 versus OGD/RP + vehicle group.
![Figure 5. Effects of OSC on [Ca2+]i in primary hippocampal neuronal cell under OGD 2 h/RP 24 h as indicated by Fluo-3/AM(×100). (A) Control cells. (B) Cells exposed to OGD 2 h/RP 24 h with no treatment of OSC. (C) Nim (12 μmol/L) was added to the culture before the reperfusion. (D–F) OSC (1, 2, and 5 μmol/L) was, respectively, added to the culture before the reperfusion. (G) Effects of OSC on [Ca2+]i in primary hippocampal neuronal cell under OGD 2 h/RP 24 h. Histograms represent mean ± SD, n = 6. ###p < 0.001 OGD/RP + vehicle group versus control group; ***p < 0.001 versus OGD/RP + vehicle group.](/cms/asset/e857c320-3ad8-42a3-8baf-c1e4ed05c09c/iphb_a_877039_f0005_b.jpg)
Figure 6. Effects of OSC on MMP changes in primary hippocampal neuronal cell under OGD 2 h/RP 24 h as indicated by JC-1(×200). (A) Control cells. (B) Cells exposed to OGD 2 h/RP 24 h with no treatment of OSC. (C) Nim (12 μmol/L) was added to the culture before the reperfusion. (D–F) OSC (1, 2, and 5 μmol/L) was, respectively, added to the culture before the reperfusion. (G) Effects of OSC on MMP changes in primary hippocampal neuronal cell under OGD 2 h/RP 24 h. Histograms represent mean ± SD, n = 6. ###p < 0.001 OGD/RP + vehicle group versus control group; **p < 0.01, ***p < 0.001 versus OGD/RP + vehicle group.
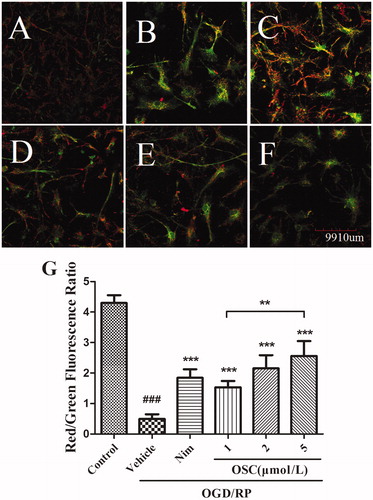
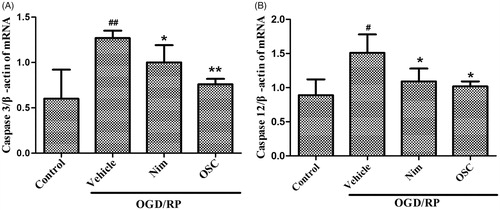
Figure 7. Effects of OSC (5 μmol/L) on OGD/RP-induced expression of caspase-3 and caspase-12 mRNA in primary hippocampal neurons as determined by real-time quantitative PCR. Data are mean ± SD, n = 3. #p < 0.05, ##p < 0.01 OGD/RP + vehicle group versus control group; *p < 0.05, **p < 0.01 versus OGD/RP + vehicle group.