Figures & data
Figure 1. Comparison activities of fractions from column chromatography by DPPH and ABTS bioassays. Each value is expressed as ± SEM, n = 3, p < 0.05 compared to positive control.
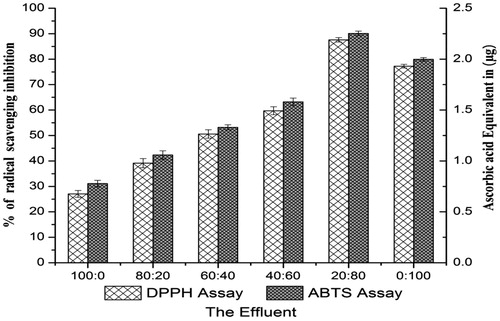
Figure 2. Total phenolic content of leaf extracts of S. xanthocarpum expressed as µg/ml of gallic acid equivalence (GAE). Values are expressed as ± SEM, n = 3, p < 0.05.
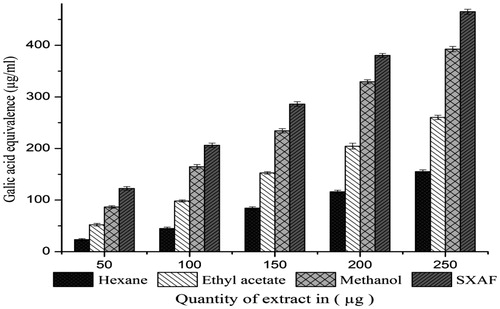
Figure 3. DPPH radical scavenging of various solvent extracts from S. xanthocarpum. Ascorbic acid was used as a positive control. Results are expressed as percentage of the control. Each value is expressed as ± SEM, n = 3, p < 0.05 compared to positive control.

Figure 4. Scavenging of ABTS• radical by S. xanthocarpum leaves extract. Values are expressed as ±SEM, n = 3, p < 0.05.
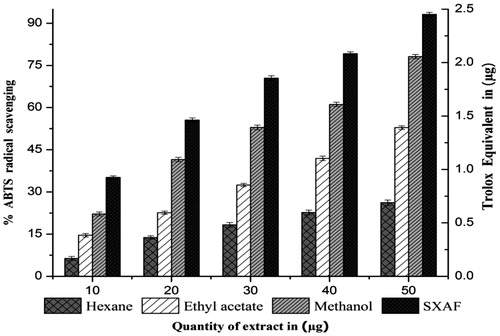
Figure 5. Reducing the power of S. xanthocarpum extracts based on the measurement of Fe+3–Fe+2 transformation. Each value is expressed as ± SEM, n = 3, p < 0.05.
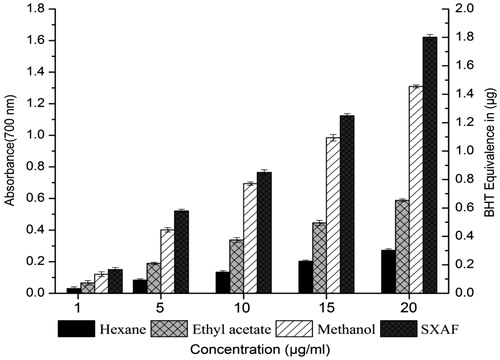
Figure 6. Effects of S. xanthocarpum active fraction (SXAF) on serum enzymes in CCl4-induced hepatotoxicity in rats. Group I – control; Group II – CCl4; Group III – SXAF 100 mg/kg b.w. + CCl4; Group IV – SXAF 200 mg/kg b.w. + CCl4; Group V – Silymarin 25 mg/kg b.w. + CCl4; LDH, lactate dehydrogenase; ALT, alanine aminotransferase; AST, aspartate aminotransferase; ALP, alkaline phosphatase. Each bar represents the mean ± SE, n = 6; bars with different alphabets differ significantly at p < 0.05 level (DMRT).
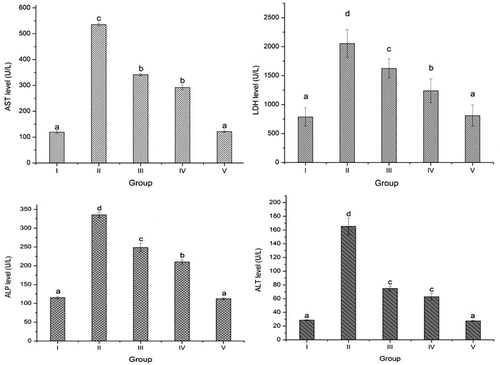
Figure 7. Effects of SXAF on the level of hepatic lipid peroxidation in CCl4-exposed rats. The values are means ± SEM (n = 5), bars with different letters differ significantly at p < 0.05 by DMRT.
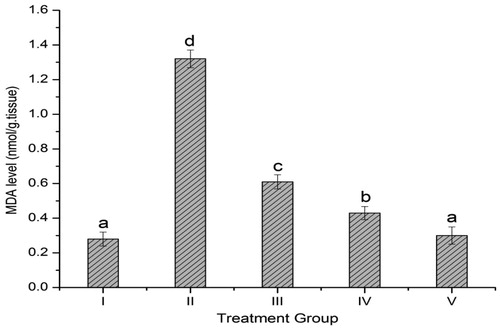
Table 1. Treatments – I: control; II: CCl4; III: SXAF (100 mg/kg) + CCl4 (1 ml/kg); IV: SXAF (200 mg/kg) + CCl4 (1 ml/kg); V: Silymarin (25 mg/kg) + CCl4 (1 ml/kg).
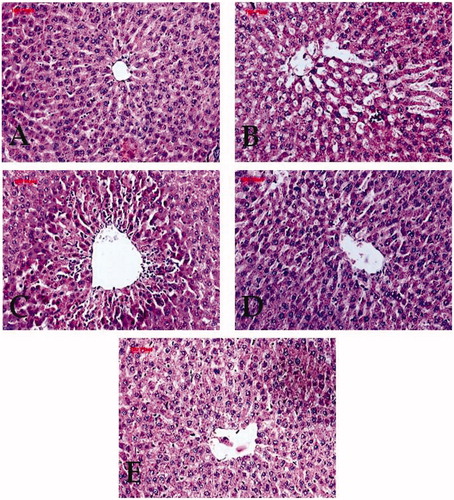
Figure 8. Effect of SXAF on the histological morphology of rat liver by hematoxylin and eosin (H & E) staining, magnification, ×400. (A) Normal control, (B) CCl4 control, (C) SXAF 100 mg/kg b.w. + CCl4, (D) SXAF 200 mg/kg b.w. + CCl4, and (E) silymarin 25 mg/kg b.w. + CCl4.