Figures & data
Figure 1. The effect of ethanol black seed extract and thymoquinone on apo A-I protein secretion. HepG2 cells were treated with the indicated amounts of black seed extract for 24 h and apo A-I and albumin levels (A) were measured by Western blot. The blots were quantified and are shown in (B). Black seed extract induced apo A-I protein synthesis but had no effect on albumin levels. HepG2 cells were treated with the indicated amounts of thymoquinone and apo A-I and albumin levels were measured in the conditioned medium by Western blot (C). The blots were quantified and are shown in (D). Apo A-I levels were normalized to albumin gene expression. Thymoquinone had no effect on apo A-I and albumin protein secretion. N = 6; *p < 0.05, treated cells relative to untreated cells.
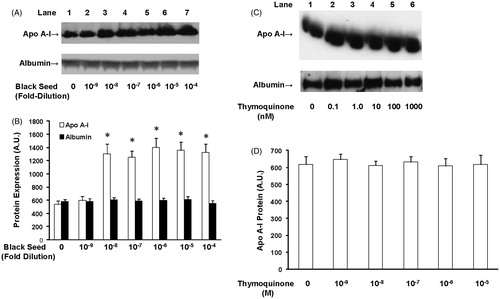
Figure 2. The effect of aqueous and volatile oil black seed fractions and trypsin digestion on apo A-I gene expression. HepG2 cells were left untreated or were treated with the indicated dilutions of either the aqueous (A) or volatile oil (B) black seed fraction for 24 h and apo A-I levels were measured in the conditioned medium. The volatile oil fraction of the black seed extract induced apo A-I gene expression; however, the aqueous fraction had no effect. HepG2 cells were either untreated or treated with a 10−5-fold dilution of black seed or a 10−5-fold dilution of black seed digested with trypsin for 24 h. Apo A-I and albumin levels were measured by Western blot (C). (D) The blots were quantified and apo A-I and albumin expression are shown. Trypsin digestion had no effect on the ability of black seed to induce apo A-I gene expression. N = 6; p < 0.05, trypsin-digested versus trypsin-undigested extract.
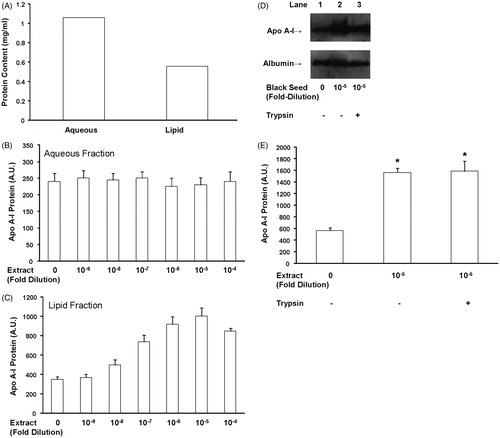
Figure 3. The effect of black seed extract on apo A-I mRNA expression and apo AI promoter activity in liver and intestinal cells. HepG2 cells were either untreated or treated with a 10−5-fold dilution of black seed for 24 h and apo A-I, albumin, and GAPDH mRNA levels were measured by quantitative real-time PCR. Apo A-I (A) and albumin (B) mRNA levels were normalized to GAPDH mRNA. Black seed treatment induced apo A-I mRNA levels but had no effect on albumin mRNA expression. (C) HepG2 cells were transfected with the plasmids pAI.474.CAT and pCMV.SPORT.β-gal and either left untreated or treated with the indicated dilution of black seed for 24 h. Treatment of black seed extract induced apo A-I promoter activity but had no effect on the CMV promoter. N = 6; *p < 0.05, treated versus untreated cells. (D) HepG2 cells were transfected with plasmids containing successive deletions of the apo A-I gene promoter and either left untreated or treated with a 10−5-fold dilution of black seed extract for 24 h. The fold-change in black seed cells relative to control cells is presented for each plasmid. Induction of apo A-I promoter activity by black seed required the region between −326 and −186. N = 3; *p < 0.05. Caco-2 cells were treated with black seed extract for 24 h and apo A-I expression was measured by Western blot (E) and apo A-I mRNA levels were measured by quantitative real-time PCR (F). Black seed induced apo A-I protein secretion and apo A-I mRNA levels. N = 6; *p < 0.05, treated versus untreated cells.
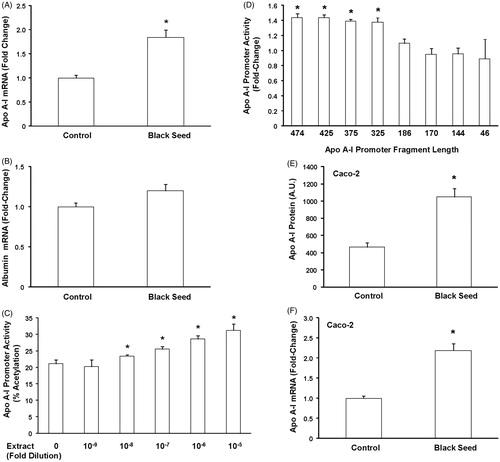
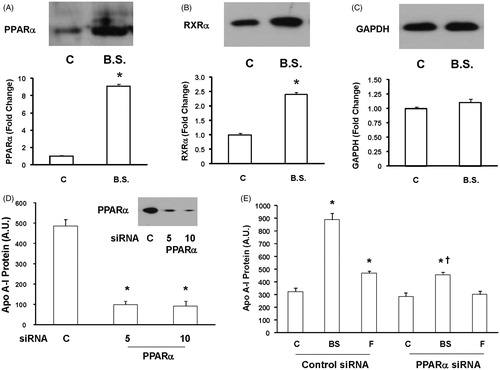
Figure 4. The effect of black seed extract on PPARα and RXRα expression. HepG2 cells were either left untreated or treated with a 10−5-fold dilution of black seed extract for 24 h and PPARα (A), RXRα (B), and GAPDH (C) expressions were measured by Western blot. Black seed induced PPARα and RXRα expressions but GAPDH levels did not change. N = 3; *p < 0.05, treated versus untreated cells. (D) HepG2 cells were transfected with 5 and 10 μM PPAR α siRNA for 72 h and PPAR α levels were measured by Western blot. N = 3; *p < 0.0001 versus control cells. (E) HepG2 cells were transfected with the control or PPARα siRNA and after 72 h, treated with or without black seed (10−5-fold dilution) or fenofibrate in SFM for 24 h. Apo A-I levels were measured by Western blot in the conditioned medium. Treatment with the control siRNA had no effect on the ability of black seed to induce apo A-I synthesis. In contrast, the addition of the PPAR α siRNA prevented most but not all the abilities of black seed to induce apo A-I protein secretion. N = 3; *p < 0.0002 and p < 0.01 in cells treated with black seed and fenofibrate, respectively, versus control cells; p < 0.02 and N.S. in cells treated with black seed and fenofibrate, respectively, versus control cells; †p < 0.02 in black seed treated cells versus fenofibrate-treated cells.