Figures & data
Figure 1. Chemical structures of costunolide and dehydrocostuslactone.
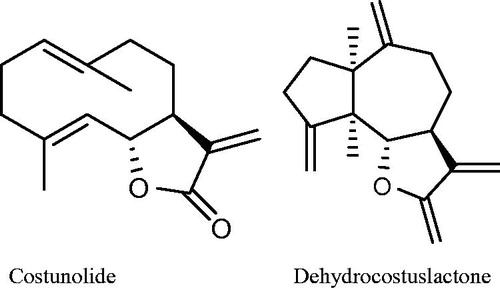
Table 1. Effects of different doses of RA ext on gastrointestinal transit in normal mice (n = 8).
Table 2. Effects of different doses of RA ext on gastrointestinal transit in neostigmine mice (n = 8).
Figure 2. Effects of different concentrations of RA ext on smooth muscle contraction of rat-isolated jejunum.
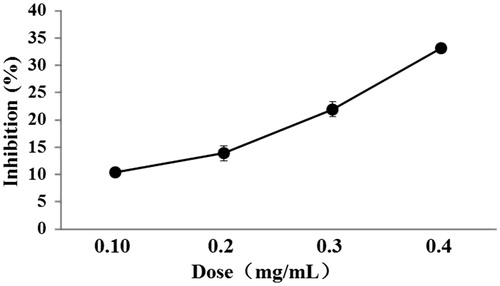
Figure 3. Effects of different concentrations of RA ext on Ach (A), 5-HT (B), KCl (C)-induced contraction of rat-isolated jejunum. The contractions induced by Ach, 5-HT and KCl in the absence of the extract acted as control. Results are mean ± SEM, n = 5. Significantly different from control ***p < 0.001.
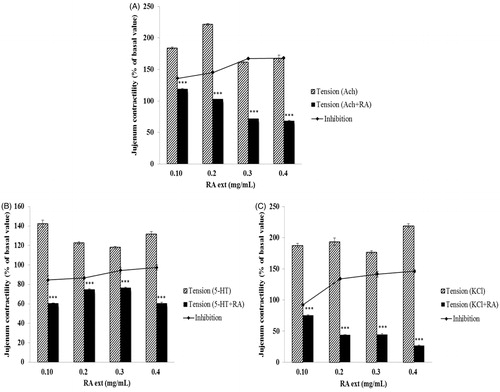
Figure 4. Dose–effect curves of CaCl2 on rabbit-isolated ileum in the absence (♦) and in the presence of RA ext (▴ 0.1 mg/mL; × 0.2 mg/mL; --- 0.3 mg/mL; • 0.4 mg/mL) and verapamil (▪ 0.025 mM). Results are mean ± SEM, n = 5.
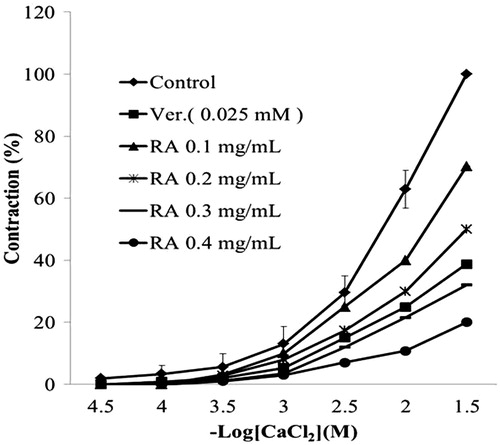
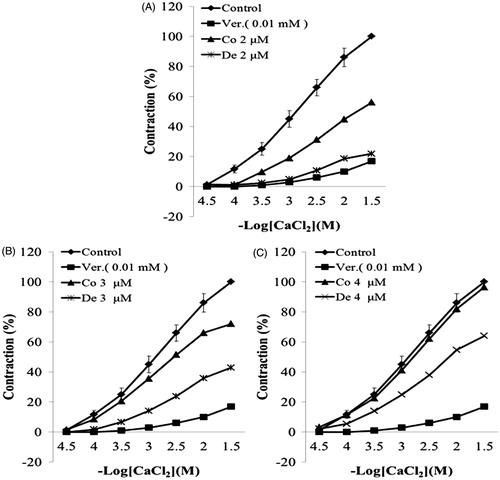
Figure 5. Dose–effect curves of CaCl2 on rabbit-isolated ileum in the absence (♦) and in the presence of RA ext, costunolide, and dehydrocostuslactone. (A) RA ext (▴ 0.2 mg/mL), costunolide (× 0.54 μg/mL), dehydrocostuslactone (--- 0.46 μg/mL), costunolide–dehydrocostuslactone (• 0.54–0.46 μg/mL), and verapamil (▪ 0.01 mM). (B) RA ext (▴ 0.3 mg/mL), costunolide (× 0.81 μg/mL), dehydrocostuslactone (--- 0.69 μg/mL), costunolide–dehydrocostuslactone (• 0.81–0.69 μg/mL), and verapamil (▪ 0.01 mM). (C) RA ext (▴ 0.4 mg/mL), costunolide (× 1.08 μg/mL), dehydrocostuslactone (--- 0.92 μg/mL), costunolide–dehydrocostuslactone (• 1.08–0.92 μg/mL), and verapamil (▪ 0.01 mM). Results are mean ± SEM, n = 5.
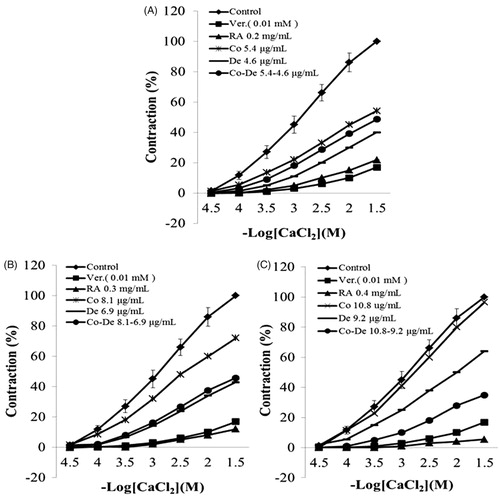
Figure 6. Dose–effect curves of CaCl2 on rabbit-isolated ileum in the absence (♦) and in the presence of costunolide and dehydrocostuslactone.