Figures & data
Figure 1. Photograph of G. trichophylla taken at collection site and its fruit.
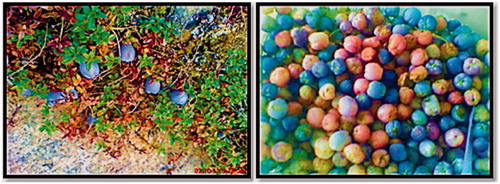
Table 1. Organoleptic evaluation of leaf, stem, and fruit of G. trichophylla.
Figure 2. TS of leaf midrib: P, pith; X, xylems; Ph, phloem; Sc, sclerenchyma; Co, collenchyma; Ep, epidermis.
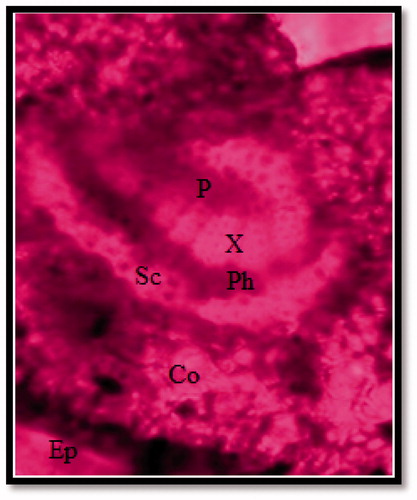
Figure 3. Venation pattern of G. trichophylla leaf.
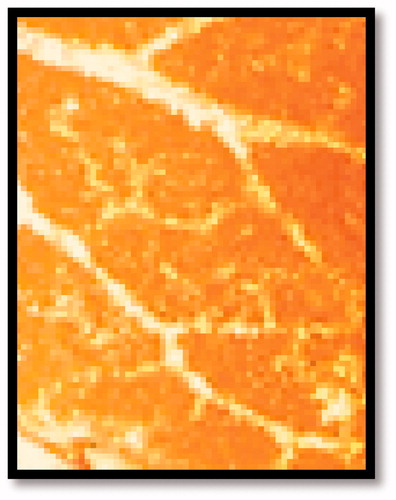
Table 2. Study of microscopic and physicochemical parameters of G. trichophylla.
Figure 4. Microscopy of stem bark of G. trichophylla. (A) Bundle of fibers(SEM), (B) wood tissue (SEM), (C) longitudinal section of (reticulate and pitted) vessels, and (D) starch grains.
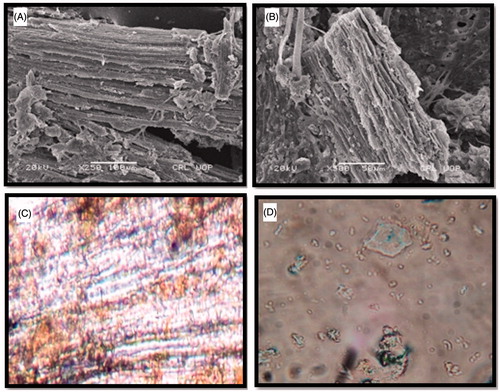
Figure 5. Scanning electron microscopy of leaf of G. trichophylla. (A) Epidermis showing arrangement of (paracytic) stomata, (B) a single stomata, (C) surface view of epidermis showing epicuticular wax, (D) palisade mesophyll, (E) upper epidermis (thick walled) in the surface view with underlying palisade and crystal of calcium oxalate, and (F) leaf setae.
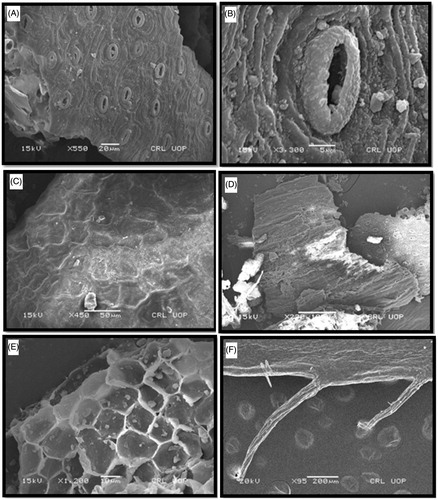
Table 3. Fluorescence analysis of powdered drug G. trichophylla in ordinary light and UV light.
Table 4. Histochemical detection of leaf, bark, and fruit of G. trichophylla.
Figure 6. HPLC chromatograph of G. trichophylla methanol extract and Rutin at 360 nm.
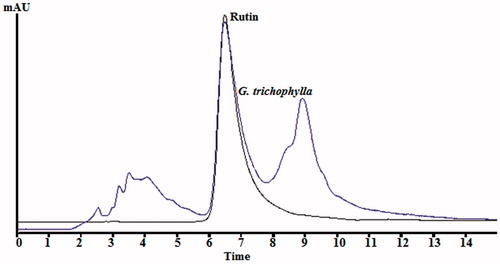
Figure 7. HPLC chromatograph of G. trichophylla chloroform extract and rutin at 360 nm.
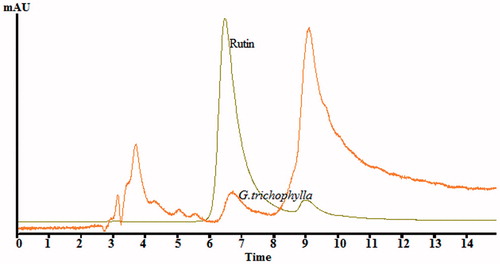
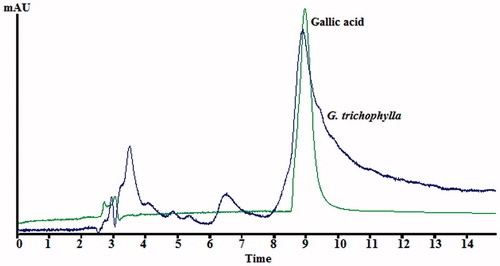
Figure 8. HPLC chromatograph of G. trichophylla methanol extract and gallic acid at 280 nm.
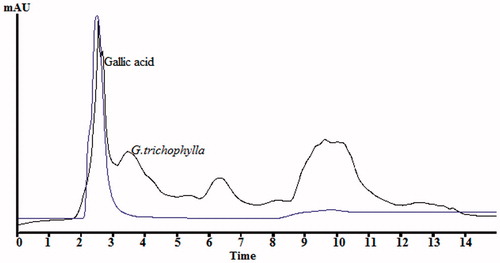
Figure 9. HPLC chromatograph of G. trichophylla chloroform extract and quercetin at 280 nm.
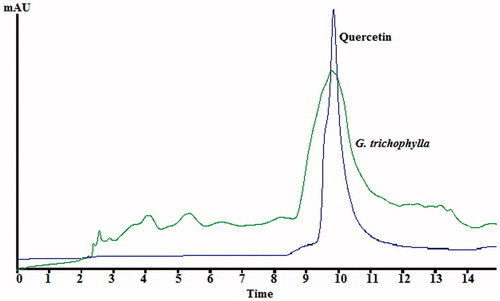
Figure 10. HPLC chromatograph of G. trichophylla chloroform extract and gallic acid at 360 nm.