Figures & data
Figure 1. Agarose gel electrophoresis image of the recombinant c-Myc-siRNA-pDNAs: M, 100 bp DNA Ladder (100–1000 bp); L1, empty vector (269 bp); L2–L4, three recombinant c-Myc-siRNA-pDNAs (316 bp).
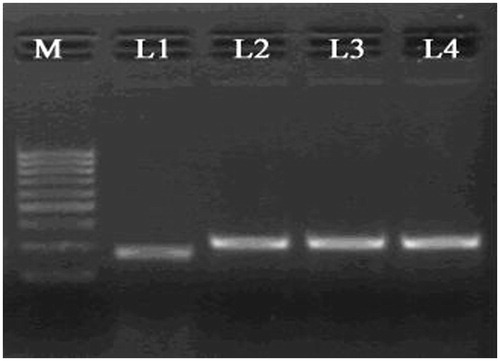
Table 1. A260/A280 ratios of siRNA-pDNAs.
Figure 2. Representative agarose gel electrophoresis image following restriction digestion of the recombinant c-Myc-siRNA-pDNAs: M, DNA marker; L1, c-Myc-siRNA3-pDNAs cut by BamHI; L2, c-Myc-siRNA3-pDNAs cut by HindIII; L3, empty vector; L4, c-Myc-siRNA3-pDNAs.
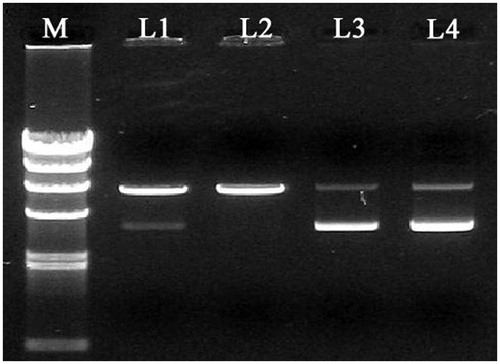
Figure 3. Fluorescence photomicrographs of green fluorescent protein expression of c-Myc-siRNA3-pDNAs after 24 h transfection: (A) c-Myc-siRNA1-pDNAs, (B) c-Myc-siRNA2-pDNAs, (C) c-Myc-siRNA3-pDNAs, and (D) c-Myc-siRNA3-pDNAs (detected with fluorescent and white light overlap).
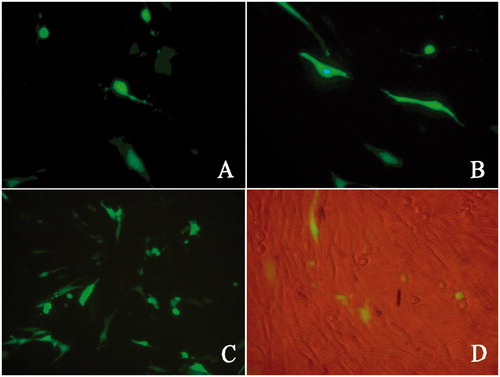
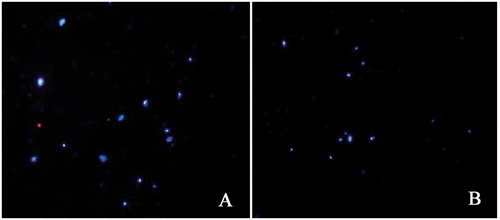
Figure 4. Fluorescence photomicrographs of Hoechst33258 and propidium iodide double staining after 24 h transfection: (A) normal C6 cells, (B) the cells incubated with Lipofectamin 2000 only, (C) the cells transfected with empty siRNA vector, (D) the cells transfected with c-Myc-siRNA1-pDNAs, (E) the cells transfected with c-Myc-siRNA2-pDNAs, and (F) the cells transfected with c-Myc-siRNA3-pDNAs.
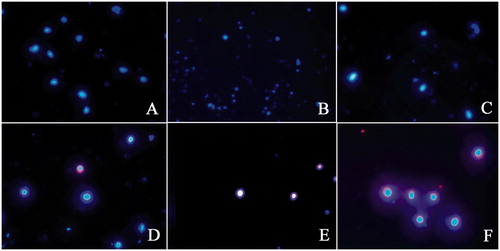
Figure 5. Apoptotic rate of C6 cells after transfection with c-Myc-siRNA-pDNAs: (A) normal C6 cells, (B) cells transfected with empty siRNA vector, (C) cells transfected with c-Myc-siRNA1-pDNAs, (D) cells transfected with c-Myc-siRNA2-pDNAs, and (E) cells transfected with c-Myc-siRNA 3-pDNAs.
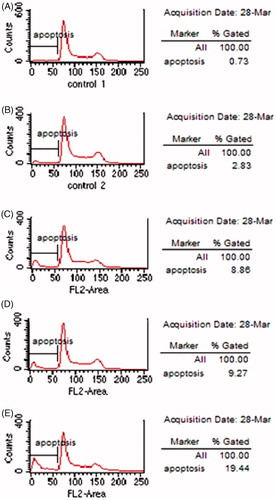
Figure 6. Transmission electron micrograph of NPs-c-Myc-siRNA3-pDNAs negatively stained with phosphotungstic acid solution. The black bar in the photograph refers to 300 nm.
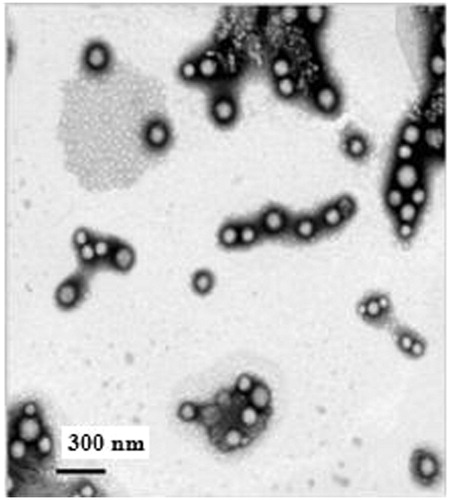
Table 2. Physicochemical properties of NPs-c-Myc-siRNA3-pDNAs.
Table 3. Apoptotic rate of C6 cells after transfection with NPs loading c-Myc-siRNA3-pDNAs (n = 3).
Figure 7. Agarose gel electrophoresis image of c-Myc-siRNA3-pDNAs after preparation of NPs: L1, the original c-Myc-siRNA3-pDNAs; L2, c-Myc-siRNA3-pDNAs extracted from the supernatant; L3, c-Myc-siRNA3-pDNAs extracted from the NPs; M, marker.
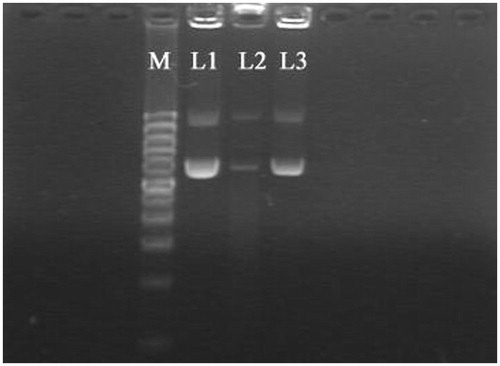
Figure 8. Agarose gel electrophoresis image of c-Myc-siRNA3-pDNAs in acid condition: L1, original c-Myc-siRNA3-pDNAs; L2, c-Myc-siRNA3-pDNAs incubated in pH 4.0 PBS for 2 h; L3, c-Myc-siRNA3-pDNAs incubated in pH 7.0 PBS for 2 h; M, marker.
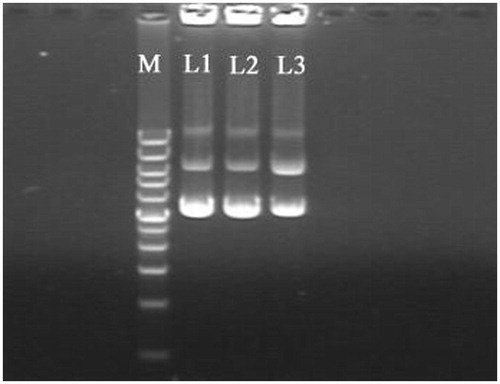
Figure 9. Agarose gel electrophoresis image of c-Myc-siRNA3-pDNAs on exposure to DNase I: L1, original c-Myc-siRNA3-pDNAs; L2, original c-Myc-siRNA3-pDNAs incubated with DNase I for 2 h; L3, NPs-c-Myc-siRNA3-pDNAs incubated with DNase I for 2 h; M, marker.
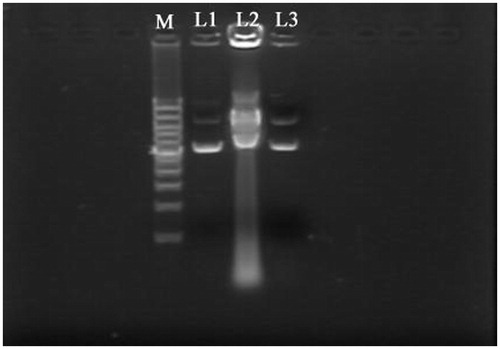
Figure 10. Fluorescence photomicrographs of green fluorescent protein expression of NPs-c-Myc-siRNA3-pDNAs after transfection for 12 h, 24 h, 48 h, and 72 h.
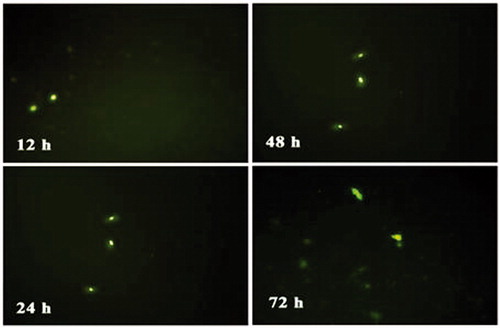
Figure 11. Fluorescence photomicrographs of C6 cells transfected with NPs-c-Myc-siRNA3-pDNAs after Hoechst33258 and propidium iodide double staining: (A) normal C6 cells and (B) C6 cells transfected with NPs-c-Myc-siRNA3-pDNAs for 48 h.