Figures & data
Figure 1. The structures of paeoniflorin (A) and albiflorin (B).
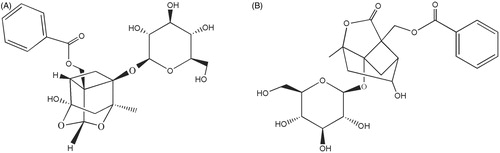
Table 1. The real-time RT-PCR oligonucleotide primers.
Figure 2. Effects of paeoniflorin and albiflorin on cell viability assay in RAW 264.7 cells.
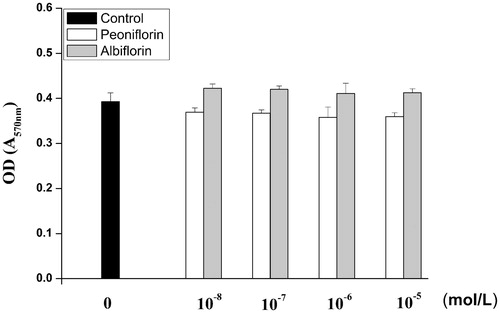
Figure 3. Effects of paeoniflorin and albiflorin on LPS-induced NO in RAW 264.7 cells. RAW 264.7 cells were incubated with the indicated concentrations of paeoniflorin, albiflorin and 0.2 μg/mL LPS for 18 h. (A) The NO content of culture medium was analyzed by the Griess reagent method. (B) IC50 of paeoniflorin and albiflorin on LPS-induced NO in RAW 264.7 cells. Data represent means ± SD values from three independent experiments. **p < 0.01 (n = 6) compared with LPS treated cells alone.
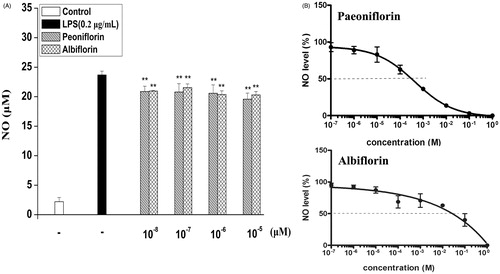
Figure 4. Effects of paeoniflorin and albiflorin on LPS-induced cytokines TNF-α and IL-6 expression. RAW 264.7 cells were incubated with the indicated concentrations of paeoniflorin, albiflorin, and 0.2 μg/mL LPS for 18 h. TNF-α (A) and IL-6 (B) in the culture medium were analyzed by ELISA. Data represent means ± SD values from three independent experiments. *p < 0.05, **p < 0.01 (n = 6) compared with LPS treated cells alone.
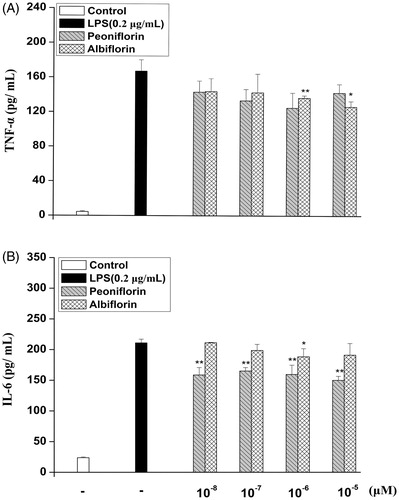
Figure 5. Effects of paeoniflorin and albiflorin on LPS-induced PGE2 production and COX-2 protein expression. RAW 264.7 cells were incubated with the indicated concentrations of paeoniflorin, albiflorin, and 0.2 μg/mL LPS for 24 h. PGE2 production in the culture medium was analyzed by ELISA. The COX-2 protein expression was analyzed by cell-based ELISA. Data represent means ± SD values from three independent experiments. *p < 0.05, **p < 0.01 (n = 6) compared with LPS-treated cells alone.
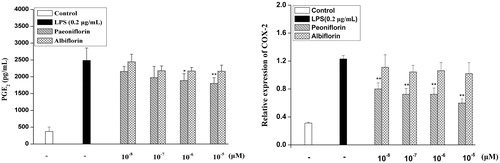
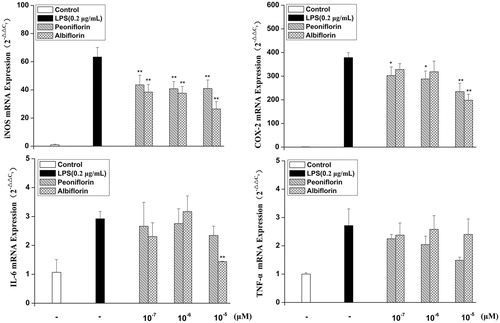
Figure 6. Effect of paeoniflorin and albiflorin on LPS-stimulated mRNA expression of iNOS, COX-2, TNF-α, and IL-6. RAW 264.7 cells were pre-incubated with indicated concentrations of paeoniflorin and albiflorin for 2 h and were then treated with 0.2 μg/mL LPS for an additional 6 h. The mRNA expression of iNOS, COX-2, and TNF-α, IL-6 was analyzed by real-time RT-PCR. Data represent means ± SD values from three independent experiments. *p < 0.05, **p < 0.01 (n = 6) compared with LPS-treated cells alone.