Figures & data
Figure 1. The intimal hyperplasia after vascular injury. A1, 7 d after vascular injury in group without treatment with significant intimal hyperplasia, right carotid artery. B1, 7 d after vascular injury and with 10 mg/kg atorvastatin treatment group with less intimal hyperplasia, right carotid artery. A2, 14 d after vascular injury in group without atorvastatin treatment with significant intimal hyperplasia, right carotid artery. B2, 14 d after vascular injury and with 10 mg/kg atorvastatin treatment group, right carotid artery, less intimal hyperplasia than without treatment group. A3, 28 d after vascular injury in group without atorvastatin treatment with significant intimal hyperplasia, right carotid artery. B3, 28 d after vascular injury in group with 10 mg/kg atorvastatin treatment, right carotid artery, less intimal hyperplasia than group without treatment. The directions of arrow are neointima.
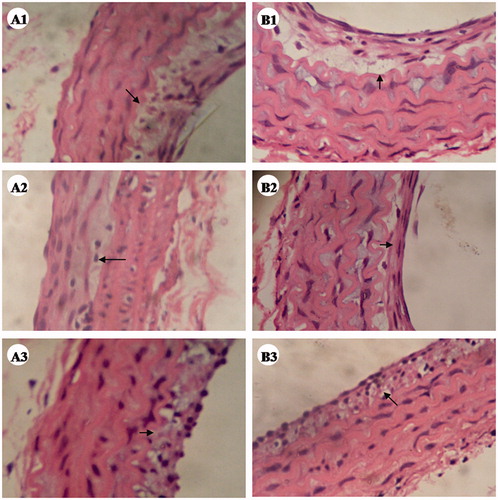
Table 1. The change of intimal media and intimal/media I/M ratio after vascular injury with or without treatment with atorvastatin.
Figure 2. The results of TUNEL staining. A1, 2, 3, and 4 are 3, 7, 14, and 28 d after vascular injury in groups without treatment, respectively. We can see significant intimal hyperplasia, and less TUNEL-positive cells. B1, 2, 3, and 4 are 3, 7, 14, and 28 d after vascular injury in groups with atorvastatin treatment, respectively. We can see less intimal hyperplasia and more TUNEL-positive cells, indicated that atorvastatin can inhibit neointimal formation and induce SMCs apoptosis.
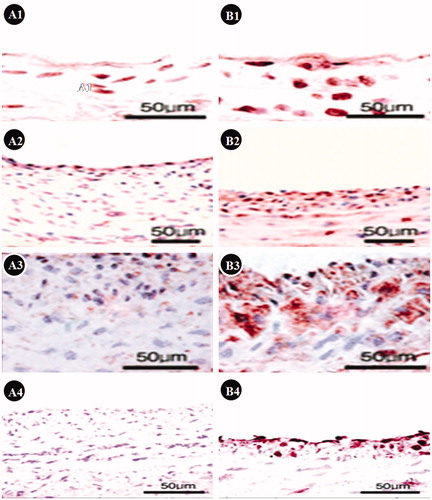
Table 2. The changes of levels of survivin and sFas in the plasma of rats after treated with atorvastatin.
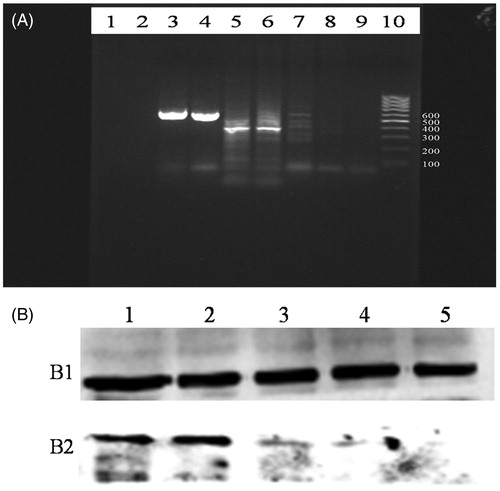
Figure 3. The expression of Fas in local vascular injury sites. (A) Relative levels of mRNAs encoding Fas in local vascular injury sites. Lane 1, β-actin. Lane 2, normal control artery with no Fas mRNA expression. Lanes 3, 4, and 5 are 28, 14, and 7 d after vascular injury and with atorvastatin treatment groups, respectively, there are Fas mRNA expressions. Lanes 6, 7, 8, and 9 is 28, 14, 7, and 3 d after vascular injury but without atorvastatin treatment, respectively, we can also see various types of Fas mRNA expression. Lane 10, marker. (B) Relative level of Fas expression was analyzed by Western Blotting. (B1) Tubulin, as an internal standard; (B2) Fas western blotting analysis. Lanes 1, 2, and 3 are 28, 14, and 7 d after vascular injury and with atorvastatin treatment groups, respectively. Lanes 4, 5, 6, and 7 are 28, 14, 7, and 3 d after vascular injury but without atorvastatin treatment, respectively. Fas protein expression is similar to the Fas mRNA expression.
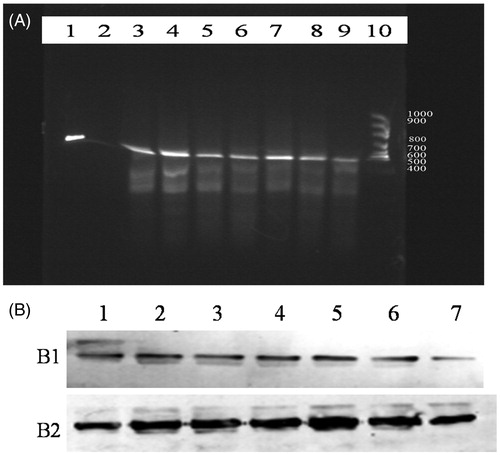
Figure 4. The expression of survivin in local vascular injury site. (A) Relative levels of mRNAs encoding survivin expression. Lane 1, blank control. Lane 2, the normal control group, no survivin mRNA expression. Lanes 3 and 4 were β-actin. Lanes 5 and 6 is 28 and 14 d after vascular injury in group without treatment, respectively, these are survivin mRNA expression. Lane 7 is 7 d after vascular injury in group without treatment, no survivin mRNA expression. Lanes 8 and 9 is 28 and 14 d after vascular injury in groups with atorvastatin treatment, respectively, no survivin mRNA expression. Lane 10, marker. (B) Relative level of survivin expression was analyzed by Western blotting. (B1) Tubulin, as an internal standard; (B2) survivin protein. Lanes 1, 2, and 3 are 28, 14, and 7 d after vascular injury in group without treatment, respectively. Lanes 4 and 5 are 28 and 14 d after vascular injury in group with atorvastatin treatment. Survivin expression is similar to the survivin mRNA.